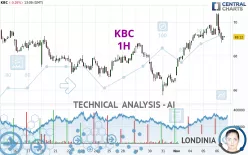
KBC - 1H - Technical analysis published on 11/06/2024 (GMT)
- 122
- 0
Click here for a new analysis!
- Timeframe : 1H
- - Analysis generated on
- Status : INVALID

Summary of the analysis

Additional analysis
Quotes
The KBC price is 69.12 EUR. On the day, this instrument lost -0.26% with the lowest point at 68.80 EUR and the highest point at 70.54 EUR. The deviation from the price is +0.47% for the low point and -2.01% for the high point.The Central Gaps scanner detects a bullish opening. A small advantage for buyers in the very short term.
Bullish opening
Type : Bullish
Timeframe : Openning
So that you have an overall view of the price change, here is a table showing the variations over several periods:
Near a new HIGH record (5 years)
Type : Bullish
Timeframe : Weekly
Near a new HIGH record (1 year)
Type : Bullish
Timeframe : Weekly
Near a new HIGH record (1st january)
Type : Bullish
Timeframe : Weekly
New HIGH record (1 month)
Type : Bullish
Timeframe : Weekly
Technical
Technical analysis of KBC in 1H shows an overall bullish trend. 75.00% of the signals given by moving averages are bullish. Caution: the neutral signals currently given by the short-term moving averages indicate that this bullish trend is showing signs of running out of steam. The Central Indicators market scanner currently does not detect any result that concerns moving averages.
In fact, only 8 technical indicators out of 18 studied are currently bearish. Caution: the Central Indicators scanner currently detects an excess:
CCI indicator is oversold : under -100
Type : Neutral
Timeframe : 1 hour
Williams %R indicator is oversold : under -80
Type : Neutral
Timeframe : 1 hour
RSI indicator is back over 50
Type : Bullish
Timeframe : 1 hour
Central Patterns, the market scanner focusing on chart patterns, resistances and supports found this result:
Near support of channel
Type : Bullish
Timeframe : 1 hour
The presence of these bearish patterns in Japanese candlesticks detected by Central Candlesticks that could cause a correction in the very short term were also noted
Bearish harami
Type : Bearish
Timeframe : 1 hour
Bearish harami cross
Type : Bearish
Timeframe : 1 hour
| S3 | S2 | S1 | Price | R1 | R2 | R3 | |
|---|---|---|---|---|---|---|---|
| ProTrendLines | 66.74 | 67.56 | 68.77 | 69.12 | 69.30 | 69.94 | 71.85 |
| Change (%) | -3.44% | -2.26% | -0.51% | - | +0.26% | +1.19% | +3.95% |
| Change | -2.38 | -1.56 | -0.35 | - | +0.18 | +0.82 | +2.73 |
| Level | Intermediate | Minor | Intermediate | - | Major | Major | Major |
Pivot points can also be used to set your price objectives. Here is the price situation in relation to pivot points:
| Pivot points | S3 | S2 | S1 | PP | R1 | R2 | R3 |
|---|---|---|---|---|---|---|---|
| Standard | 68.15 | 68.61 | 68.95 | 69.41 | 69.75 | 70.21 | 70.55 |
| Camarilla | 69.08 | 69.15 | 69.23 | 69.30 | 69.37 | 69.45 | 69.52 |
| Woodie | 68.10 | 68.58 | 68.90 | 69.38 | 69.70 | 70.18 | 70.50 |
| Fibonacci | 68.61 | 68.91 | 69.10 | 69.41 | 69.71 | 69.90 | 70.21 |
| Pivot points | S3 | S2 | S1 | PP | R1 | R2 | R3 |
|---|---|---|---|---|---|---|---|
| Standard | 63.36 | 64.52 | 66.48 | 67.64 | 69.60 | 70.76 | 72.72 |
| Camarilla | 67.58 | 67.87 | 68.15 | 68.44 | 68.73 | 69.01 | 69.30 |
| Woodie | 63.76 | 64.72 | 66.88 | 67.84 | 70.00 | 70.96 | 73.12 |
| Fibonacci | 64.52 | 65.71 | 66.45 | 67.64 | 68.83 | 69.57 | 70.76 |
| Pivot points | S3 | S2 | S1 | PP | R1 | R2 | R3 |
|---|---|---|---|---|---|---|---|
| Standard | 58.40 | 62.04 | 64.36 | 68.00 | 70.32 | 73.96 | 76.28 |
| Camarilla | 65.04 | 65.59 | 66.13 | 66.68 | 67.23 | 67.77 | 68.32 |
| Woodie | 57.74 | 61.71 | 63.70 | 67.67 | 69.66 | 73.63 | 75.62 |
| Fibonacci | 62.04 | 64.32 | 65.72 | 68.00 | 70.28 | 71.68 | 73.96 |
Numerical data
The following are the details of the technical indicators and moving averages that were collected to generate this technical analysis:
| RSI (14): | 51.39 | |
| MACD (12,26,9): | 0.2900 | |
| Directional Movement: | 3.64 | |
| AROON (14): | -14.29 | |
| DEMA (21): | 69.69 | |
| Parabolic SAR (0,02-0,02-0,2): | 70.47 | |
| Elder Ray (13): | -0.31 | |
| Super Trend (3,10): | 68.93 | |
| Zig ZAG (10): | 69.12 | |
| VORTEX (21): | 0.9700 | |
| Stochastique (14,3,5): | 16.27 | |
| TEMA (21): | 69.59 | |
| Williams %R (14): | -85.06 | |
| Chande Momentum Oscillator (20): | -0.28 | |
| Repulse (5,40,3): | -0.5800 | |
| ROCnROLL: | -1 | |
| TRIX (15,9): | 0.0900 | |
| Courbe Coppock: | 0.54 |
| MA7: | 68.20 | |
| MA20: | 68.30 | |
| MA50: | 68.99 | |
| MA100: | 68.50 | |
| MAexp7: | 69.36 | |
| MAexp20: | 69.24 | |
| MAexp50: | 68.65 | |
| MAexp100: | 68.37 | |
| Price / MA7: | +1.35% | |
| Price / MA20: | +1.20% | |
| Price / MA50: | +0.19% | |
| Price / MA100: | +0.91% | |
| Price / MAexp7: | -0.35% | |
| Price / MAexp20: | -0.17% | |
| Price / MAexp50: | +0.68% | |
| Price / MAexp100: | +1.10% |
News
The latest news and videos published on KBC at the time of the analysis were as follows:
- KBC Group: Notification for bondholders of KBC IFIMA
- KBC Group: Update regarding the KBC Group share buyback programme
- KIBHO Company Announces Landmark Launch of KBC Coin on BitMart Exchange
- KBC Group: Bartel Puelinckx will replace Luc Popelier as KBC Group CFO
- KBC Group: Update regarding the KBC Group share buyback programme
About author
Online


Add a comment
Comments
0 comments on the analysis KBC - 1H