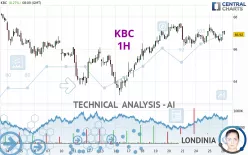
KBC - 1H - Technical analysis published on 06/26/2024 (GMT)
- 165
- 0
Click here for a new analysis!
- Timeframe : 1H
- - Analysis generated on
- Status : INVALID

Summary of the analysis

Additional analysis
Quotes
The KBC rating is 67.10 EUR. On the day, this instrument gained +0.54% with the lowest point at 66.56 EUR and the highest point at 67.14 EUR. The deviation from the price is +0.81% for the low point and -0.06% for the high point.The Central Gaps scanner detects a bullish opening. A small advantage for buyers in the very short term.
Bullish opening
Type : Bullish
Timeframe : Openning
So that you have an overall view of the price change, here is a table showing the variations over several periods:
Near a new HIGH record (5 years)
Type : Bullish
Timeframe : Weekly
Near a new HIGH record (1 year)
Type : Bullish
Timeframe : Weekly
Near a new HIGH record (1st january)
Type : Bullish
Timeframe : Weekly
Near a new HIGH record (1 month)
Type : Bullish
Timeframe : Weekly
Technical
A technical analysis in 1H of this KBC chart shows a strongly bullish trend. 92.86% of the signals given by moving averages are bullish. This strongly bullish trend is supported by the strong bullish signals given by short-term moving averages. An assessment of moving averages reveals a bullish signal that could impact this trend:
Bullish trend reversal : adaptative moving average 20
Type : Bullish
Timeframe : 1 hour
An assessment of technical indicators shows a slightly bullish signal.
Other results related to technical indicators were also found by the Central Indicators scanner:
RSI indicator is back over 50
Type : Bullish
Timeframe : 1 hour
Ichimoku : price is over the cloud
Type : Bullish
Timeframe : 1 hour
No signals are given by Central Patterns, a market scanner specialised in chart patterns, resistances and supports.
Central Candlesticks, the scanner specialised in Japanese candlesticks, detects these signals that could have an impact on the current short-term trend:
Bearish doji star
Type : Bearish
Timeframe : 1 hour
Doji
Type : Neutral
Timeframe : 1 hour
| S3 | S2 | S1 | Price | R1 | R2 | R3 | |
|---|---|---|---|---|---|---|---|
| ProTrendLines | 64.92 | 66.10 | 66.81 | 67.10 | 67.49 | 68.40 | 69.30 |
| Change (%) | -3.25% | -1.49% | -0.43% | - | +0.58% | +1.94% | +3.28% |
| Change | -2.18 | -1.00 | -0.29 | - | +0.39 | +1.30 | +2.20 |
| Level | Minor | Major | Intermediate | - | Intermediate | Minor | Major |
Pivot points can also be used to set your price objectives. Here is the price situation in relation to pivot points:
| Pivot points | S3 | S2 | S1 | PP | R1 | R2 | R3 |
|---|---|---|---|---|---|---|---|
| Standard | 65.14 | 65.78 | 66.26 | 66.90 | 67.38 | 68.02 | 68.50 |
| Camarilla | 66.43 | 66.54 | 66.64 | 66.74 | 66.84 | 66.95 | 67.05 |
| Woodie | 65.06 | 65.74 | 66.18 | 66.86 | 67.30 | 67.98 | 68.42 |
| Fibonacci | 65.78 | 66.21 | 66.47 | 66.90 | 67.33 | 67.59 | 68.02 |
| Pivot points | S3 | S2 | S1 | PP | R1 | R2 | R3 |
|---|---|---|---|---|---|---|---|
| Standard | 61.23 | 62.75 | 64.59 | 66.11 | 67.95 | 69.47 | 71.31 |
| Camarilla | 65.52 | 65.82 | 66.13 | 66.44 | 66.75 | 67.06 | 67.36 |
| Woodie | 61.40 | 62.83 | 64.76 | 66.19 | 68.12 | 69.55 | 71.48 |
| Fibonacci | 62.75 | 64.03 | 64.82 | 66.11 | 67.39 | 68.18 | 69.47 |
| Pivot points | S3 | S2 | S1 | PP | R1 | R2 | R3 |
|---|---|---|---|---|---|---|---|
| Standard | 58.99 | 61.99 | 64.42 | 67.42 | 69.85 | 72.85 | 75.28 |
| Camarilla | 65.37 | 65.87 | 66.36 | 66.86 | 67.36 | 67.86 | 68.35 |
| Woodie | 58.72 | 61.85 | 64.15 | 67.28 | 69.58 | 72.71 | 75.01 |
| Fibonacci | 61.99 | 64.06 | 65.34 | 67.42 | 69.49 | 70.77 | 72.85 |
Numerical data
The following are the details of the technical indicators and moving averages that were collected to generate this technical analysis:
| RSI (14): | 52.83 | |
| MACD (12,26,9): | 0.0200 | |
| Directional Movement: | 4.31 | |
| AROON (14): | 21.42 | |
| DEMA (21): | 66.85 | |
| Parabolic SAR (0,02-0,02-0,2): | 67.43 | |
| Elder Ray (13): | 0.03 | |
| Super Trend (3,10): | 67.54 | |
| Zig ZAG (10): | 66.94 | |
| VORTEX (21): | 1.0600 | |
| Stochastique (14,3,5): | 34.97 | |
| TEMA (21): | 66.78 | |
| Williams %R (14): | -40.98 | |
| Chande Momentum Oscillator (20): | 0.58 | |
| Repulse (5,40,3): | 0.4900 | |
| ROCnROLL: | 1 | |
| TRIX (15,9): | 0.0100 | |
| Courbe Coppock: | 0.31 |
| MA7: | 66.83 | |
| MA20: | 66.22 | |
| MA50: | 66.68 | |
| MA100: | 64.63 | |
| MAexp7: | 66.90 | |
| MAexp20: | 66.79 | |
| MAexp50: | 66.58 | |
| MAexp100: | 66.34 | |
| Price / MA7: | +0.40% | |
| Price / MA20: | +1.33% | |
| Price / MA50: | +0.63% | |
| Price / MA100: | +3.82% | |
| Price / MAexp7: | +0.30% | |
| Price / MAexp20: | +0.46% | |
| Price / MAexp50: | +0.78% | |
| Price / MAexp100: | +1.15% |
News
Don't forget to follow the news on KBC. At the time of publication of this analysis, the latest news was as follows:
- KBC Group: Bartel Puelinckx will replace Luc Popelier as KBC Group CFO
- KBC Group: Update regarding the KBC Group share buyback programme
- KBC Group: Regulated information – 16 May 2024 after trading hours (18h00)
- KBC Group: Update regarding the KBC Group share buyback programme
- KBC Group: Notification for bondholders of KBC IFIMA
About author
Online


Add a comment
Comments
0 comments on the analysis KBC - 1H