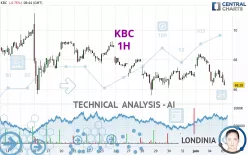
KBC - 1H - Technical analysis published on 06/05/2024 (GMT)
- 143
- 0
Click here for a new analysis!
- Timeframe : 1H
- - Analysis generated on
- Status : TARGET REACHED

Summary of the analysis

Additional analysis
Quotes
The KBC rating is 66.42 EUR. On the day, this instrument lost -0.54% and was traded between 66.36 EUR and 67.14 EUR over the period. The price is currently at +0.09% from its lowest and -1.07% from its highest.A bullish opening was detected by the Central Gaps scanner. Buyers are trying to impose a bullish momentum in the very short term.
Bullish opening
Type : Bullish
Timeframe : Openning
A study of price movements over other periods shows the following variations:
Near a new HIGH record (5 years)
Type : Bullish
Timeframe : Weekly
Near a new HIGH record (1 year)
Type : Bullish
Timeframe : Weekly
Near a new HIGH record (1st january)
Type : Bullish
Timeframe : Weekly
Near a new HIGH record (1 month)
Type : Bullish
Timeframe : Weekly
Technical
Technical analysis of this 1H chart of KBC indicates that the overall trend is strongly bearish. 85.71% of the signals given by moving averages are bearish. This strongly bearish trend is supported by the strong bearish signals given by short-term moving averages. The Central Indicators scanner does not detect any result on moving averages that would impact this trend.
Technical indicators are bearish. There is still some doubt about the decline in the price.
Caution: the Central Indicators scanner currently detects an excess:
CCI indicator is oversold : under -100
Type : Neutral
Timeframe : 1 hour
Williams %R indicator is oversold : under -80
Type : Neutral
Timeframe : 1 hour
Price is back under the pivot point
Type : Bearish
Timeframe : Weekly
No signals are given by Central Patterns, a market scanner specialised in chart patterns, resistances and supports.
The Central Candlesticks scanner which studies Japanese candlesticks did not detect anything.
| S3 | S2 | S1 | Price | R1 | R2 | R3 | |
|---|---|---|---|---|---|---|---|
| ProTrendLines | 64.98 | 65.60 | 66.23 | 66.42 | 66.64 | 67.55 | 68.06 |
| Change (%) | -2.17% | -1.23% | -0.29% | - | +0.33% | +1.70% | +2.47% |
| Change | -1.44 | -0.82 | -0.19 | - | +0.22 | +1.13 | +1.64 |
| Level | Minor | Minor | Intermediate | - | Intermediate | Minor | Minor |
To determine price objectives, it is also possible to use the pivot points. Here is the price position in relation to pivot points:
| Pivot points | S3 | S2 | S1 | PP | R1 | R2 | R3 |
|---|---|---|---|---|---|---|---|
| Standard | 64.63 | 65.43 | 66.11 | 66.91 | 67.59 | 68.39 | 69.07 |
| Camarilla | 66.37 | 66.51 | 66.64 | 66.78 | 66.92 | 67.05 | 67.19 |
| Woodie | 64.56 | 65.40 | 66.04 | 66.88 | 67.52 | 68.36 | 69.00 |
| Fibonacci | 65.43 | 66.00 | 66.35 | 66.91 | 67.48 | 67.83 | 68.39 |
| Pivot points | S3 | S2 | S1 | PP | R1 | R2 | R3 |
|---|---|---|---|---|---|---|---|
| Standard | 63.16 | 64.38 | 65.62 | 66.84 | 68.08 | 69.30 | 70.54 |
| Camarilla | 66.18 | 66.41 | 66.64 | 66.86 | 67.09 | 67.31 | 67.54 |
| Woodie | 63.17 | 64.39 | 65.63 | 66.85 | 68.09 | 69.31 | 70.55 |
| Fibonacci | 64.38 | 65.32 | 65.90 | 66.84 | 67.78 | 68.36 | 69.30 |
| Pivot points | S3 | S2 | S1 | PP | R1 | R2 | R3 |
|---|---|---|---|---|---|---|---|
| Standard | 58.99 | 61.99 | 64.42 | 67.42 | 69.85 | 72.85 | 75.28 |
| Camarilla | 65.37 | 65.87 | 66.36 | 66.86 | 67.36 | 67.86 | 68.35 |
| Woodie | 58.72 | 61.85 | 64.15 | 67.28 | 69.58 | 72.71 | 75.01 |
| Fibonacci | 61.99 | 64.06 | 65.34 | 67.42 | 69.49 | 70.77 | 72.85 |
Numerical data
The following are the details of the technical indicators and moving averages that were collected to generate this technical analysis:
| RSI (14): | 38.35 | |
| MACD (12,26,9): | -0.1700 | |
| Directional Movement: | -11.42 | |
| AROON (14): | -42.86 | |
| DEMA (21): | 66.88 | |
| Parabolic SAR (0,02-0,02-0,2): | 67.50 | |
| Elder Ray (13): | -0.44 | |
| Super Trend (3,10): | 67.61 | |
| Zig ZAG (10): | 66.42 | |
| VORTEX (21): | 0.8500 | |
| Stochastique (14,3,5): | 16.38 | |
| TEMA (21): | 66.68 | |
| Williams %R (14): | -90.63 | |
| Chande Momentum Oscillator (20): | -1.40 | |
| Repulse (5,40,3): | -1.2200 | |
| ROCnROLL: | 2 | |
| TRIX (15,9): | -0.0100 | |
| Courbe Coppock: | 3.48 |
| MA7: | 66.87 | |
| MA20: | 67.51 | |
| MA50: | 66.48 | |
| MA100: | 63.18 | |
| MAexp7: | 66.75 | |
| MAexp20: | 67.05 | |
| MAexp50: | 67.15 | |
| MAexp100: | 67.21 | |
| Price / MA7: | -0.67% | |
| Price / MA20: | -1.61% | |
| Price / MA50: | -0.09% | |
| Price / MA100: | +5.13% | |
| Price / MAexp7: | -0.49% | |
| Price / MAexp20: | -0.94% | |
| Price / MAexp50: | -1.09% | |
| Price / MAexp100: | -1.18% |
News
The latest news and videos published on KBC at the time of the analysis were as follows:
- KBC Group: Update regarding the KBC Group share buyback programme
- KBC Group: Regulated information – 16 May 2024 after trading hours (18h00)
- KBC Group: Update regarding the KBC Group share buyback programme
- KBC Group: Notification for bondholders of KBC IFIMA
- KBC Group: Board change at KBC Group
About author
Online


Add a comment
Comments
0 comments on the analysis KBC - 1H