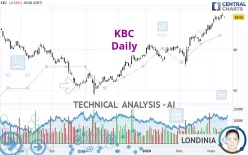
KBC - Daily - Technical analysis published on 03/14/2024 (GMT)
- 155
- 0
Click here for a new analysis!
- Timeframe : Daily
- - Analysis generated on
- Status : LEVEL MAINTAINED

Summary of the analysis

Additional analysis
Quotes
The KBC price is 68.06 EUR. On the day, this instrument lost -0.56% with the lowest point at 67.76 EUR and the highest point at 68.16 EUR. The deviation from the price is +0.44% for the low point and -0.15% for the high point.The Central Gaps scanner detects a bearish gap which is a sign that the sellers have taken the lead in the very short term.
Opening Gap DOWN
Type : Bearish
Timeframe : Openning
A study of price movements over other periods shows the following variations:
New HIGH record (5 years)
Type : Bullish
Timeframe : Weekly
Near a new HIGH record (1 year)
Type : Bullish
Timeframe : Weekly
Near a new HIGH record (1st january)
Type : Bullish
Timeframe : Weekly
Near a new HIGH record (1 month)
Type : Bullish
Timeframe : Weekly
Technical
A technical analysis in Daily of this KBC chart shows a strongly bullish trend. 92.86% of the signals given by moving averages are bullish. This strongly bullish trend is supported by the strong bullish signals given by short-term moving averages. The Central Indicators scanner does not detect any result on moving averages that would impact this trend.
In fact, according to the parameters integrated into the Central Analyzer system, 13 technical indicators out of 18 analysed are currently bullish. Caution: the Central Indicators scanner currently detects an excess:
Williams %R indicator is overbought : over -20
Type : Neutral
Timeframe : Daily
Pivot points : price is under support 1
Type : Neutral
Timeframe : Daily
Central Patterns, the market scanner focusing on chart patterns, resistances and supports found this result:
Near resistance of channel
Type : Bearish
Timeframe : Daily
For a small setback in the very short term, the Central Candlesticks scanner currently notes the presence of this bearish pattern in Japanese candlesticks:
Downside gap
Type : Bearish
Timeframe : Daily
| S3 | S2 | S1 | Price | |
|---|---|---|---|---|
| ProTrendLines | 56.58 | 60.74 | 67.53 | 68.06 |
| Change (%) | -16.87% | -10.76% | -0.78% | - |
| Change | -11.48 | -7.32 | -0.53 | - |
| Level | Minor | Intermediate | Major | - |
To determine price objectives, it is also possible to use the pivot points. Here is the price position in relation to pivot points:
| Pivot points | S3 | S2 | S1 | PP | R1 | R2 | R3 |
|---|---|---|---|---|---|---|---|
| Standard | 67.28 | 67.76 | 68.10 | 68.58 | 68.92 | 69.40 | 69.74 |
| Camarilla | 68.22 | 68.29 | 68.37 | 68.44 | 68.52 | 68.59 | 68.67 |
| Woodie | 67.21 | 67.73 | 68.03 | 68.55 | 68.85 | 69.37 | 69.67 |
| Fibonacci | 67.76 | 68.07 | 68.27 | 68.58 | 68.89 | 69.09 | 69.40 |
| Pivot points | S3 | S2 | S1 | PP | R1 | R2 | R3 |
|---|---|---|---|---|---|---|---|
| Standard | 63.63 | 64.71 | 66.29 | 67.37 | 68.95 | 70.03 | 71.61 |
| Camarilla | 67.15 | 67.39 | 67.64 | 67.88 | 68.12 | 68.37 | 68.61 |
| Woodie | 63.89 | 64.84 | 66.55 | 67.50 | 69.21 | 70.16 | 71.87 |
| Fibonacci | 64.71 | 65.72 | 66.35 | 67.37 | 68.38 | 69.01 | 70.03 |
| Pivot points | S3 | S2 | S1 | PP | R1 | R2 | R3 |
|---|---|---|---|---|---|---|---|
| Standard | 48.34 | 52.18 | 58.54 | 62.38 | 68.74 | 72.58 | 78.94 |
| Camarilla | 62.10 | 63.03 | 63.97 | 64.90 | 65.84 | 66.77 | 67.71 |
| Woodie | 49.60 | 52.81 | 59.80 | 63.01 | 70.00 | 73.21 | 80.20 |
| Fibonacci | 52.18 | 56.08 | 58.48 | 62.38 | 66.28 | 68.68 | 72.58 |
Numerical data
The following are the details of the technical indicators and moving averages that were collected to generate this technical analysis:
| RSI (14): | 67.92 | |
| MACD (12,26,9): | 1.9000 | |
| Directional Movement: | 20.66 | |
| AROON (14): | 92.86 | |
| DEMA (21): | 68.42 | |
| Parabolic SAR (0,02-0,02-0,2): | 67.59 | |
| Elder Ray (13): | 1.02 | |
| Super Trend (3,10): | 65.46 | |
| Zig ZAG (10): | 68.06 | |
| VORTEX (21): | 1.1800 | |
| Stochastique (14,3,5): | 89.61 | |
| TEMA (21): | 68.98 | |
| Williams %R (14): | -19.77 | |
| Chande Momentum Oscillator (20): | 2.94 | |
| Repulse (5,40,3): | 0.6700 | |
| ROCnROLL: | 1 | |
| TRIX (15,9): | 0.4200 | |
| Courbe Coppock: | 13.81 |
| MA7: | 68.03 | |
| MA20: | 65.70 | |
| MA50: | 62.25 | |
| MA100: | 58.24 | |
| MAexp7: | 67.81 | |
| MAexp20: | 65.94 | |
| MAexp50: | 62.94 | |
| MAexp100: | 60.69 | |
| Price / MA7: | +0.04% | |
| Price / MA20: | +3.59% | |
| Price / MA50: | +9.33% | |
| Price / MA100: | +16.86% | |
| Price / MAexp7: | +0.37% | |
| Price / MAexp20: | +3.22% | |
| Price / MAexp50: | +8.13% | |
| Price / MAexp100: | +12.14% |
News
The last news published on KBC at the time of the generation of this analysis was as follows:
- KBC Group: Update regarding the KBC Group share buyback programme
- KBC Group: Update regarding the KBC Group share buyback programme
- KBC Group: Update regarding the KBC Group share buyback programme
- KBC Group: KBC to call Additional Tier-1 (AT1) Securities it issued in 2019
- KBC Group: Update regarding the KBC Group share buyback programme
About author
Online


Add a comment
Comments
0 comments on the analysis KBC - Daily