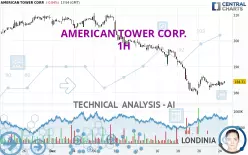
AMERICAN TOWER CORP. - 1H - Technical analysis published on 12/24/2024 (GMT)
- 100
- 0
Click here for a new analysis!
- Timeframe : 1H
- - Analysis generated on
- Status : LEVEL MAINTAINED

Summary of the analysis

Additional analysis
Quotes
The AMERICAN TOWER CORP. price is 184.31 USD. The price is lower by -0.04% since the last closing with the lowest point at 182.54 USD and the highest point at 184.58 USD. The deviation from the price is +0.97% for the low point and -0.15% for the high point.The Central Gaps scanner detects a bearish opening marking the presence of sellers ahead of buyers at the opening but not sufficiently marked to allow the price to register a quotation gap.
Bearish opening
Type : Bearish
Timeframe : Openning
So that you have an overall view of the price change, here is a table showing the variations over several periods:
Near a new LOW record (1 month)
Type : Bearish
Timeframe : Weekly
Technical
Technical analysis of this 1H chart of AMERICAN TOWER CORP. indicates that the overall trend is bearish. 75.00% of the signals given by moving averages are bearish. Caution: the neutral signals currently given by short-term moving averages show us that the global trend is losing momentum. An assessment of moving averages reveals a bullish signal that could impact this trend:
Bullish price crossover with adaptative moving average 50
Type : Bullish
Timeframe : 1 hour
In fact, only 9 technical indicators out of 18 studied are currently bullish. Central Indicators, the scanner specialised in technical indicators, has identified these signals:
Momentum indicator is back over 0
Type : Bullish
Timeframe : 1 hour
Williams %R indicator is back over -50
Type : Bullish
Timeframe : 1 hour
An analysis of the price chart with the Central Patterns scanner (detector of chart patterns and resistances and supports) shows a result that can have an impact on the price change:
Near horizontal resistance
Type : Bearish
Timeframe : 1 hour
No result was found by the Central Candlesticks scanner on Japanese candlesticks.
| S3 | S2 | S1 | Price | R1 | R2 | R3 | |
|---|---|---|---|---|---|---|---|
| ProTrendLines | 168.48 | 179.04 | 184.20 | 184.31 | 193.42 | 198.77 | 204.79 |
| Change (%) | -8.59% | -2.86% | -0.06% | - | +4.94% | +7.85% | +11.11% |
| Change | -15.83 | -5.27 | -0.11 | - | +9.11 | +14.46 | +20.48 |
| Level | Intermediate | Intermediate | Major | - | Major | Intermediate | Major |
Pivot points can also be used to set your price objectives. Here is the price situation in relation to pivot points:
| Pivot points | S3 | S2 | S1 | PP | R1 | R2 | R3 |
|---|---|---|---|---|---|---|---|
| Standard | 178.51 | 179.77 | 182.08 | 183.34 | 185.65 | 186.91 | 189.22 |
| Camarilla | 183.40 | 183.73 | 184.05 | 184.38 | 184.71 | 185.04 | 185.36 |
| Woodie | 179.03 | 180.03 | 182.60 | 183.60 | 186.17 | 187.17 | 189.74 |
| Fibonacci | 179.77 | 181.14 | 181.98 | 183.34 | 184.71 | 185.55 | 186.91 |
| Pivot points | S3 | S2 | S1 | PP | R1 | R2 | R3 |
|---|---|---|---|---|---|---|---|
| Standard | 155.90 | 167.47 | 175.60 | 187.17 | 195.30 | 206.87 | 215.00 |
| Camarilla | 178.31 | 180.12 | 181.92 | 183.73 | 185.54 | 187.34 | 189.15 |
| Woodie | 154.18 | 166.61 | 173.88 | 186.31 | 193.58 | 206.01 | 213.28 |
| Fibonacci | 167.47 | 175.00 | 179.65 | 187.17 | 194.70 | 199.35 | 206.87 |
| Pivot points | S3 | S2 | S1 | PP | R1 | R2 | R3 |
|---|---|---|---|---|---|---|---|
| Standard | 167.09 | 179.42 | 194.27 | 206.60 | 221.45 | 233.78 | 248.63 |
| Camarilla | 201.66 | 204.15 | 206.64 | 209.13 | 211.62 | 214.11 | 216.61 |
| Woodie | 168.36 | 180.05 | 195.54 | 207.23 | 222.72 | 234.41 | 249.90 |
| Fibonacci | 179.42 | 189.80 | 196.21 | 206.60 | 216.98 | 223.39 | 233.78 |
Numerical data
The following is the status of technical indicators and moving averages registered at the time this technical analysis was created:
| RSI (14): | 45.26 | |
| MACD (12,26,9): | -1.1700 | |
| Directional Movement: | -9.47 | |
| AROON (14): | -28.57 | |
| DEMA (21): | 182.26 | |
| Parabolic SAR (0,02-0,02-0,2): | 185.51 | |
| Elder Ray (13): | 0.26 | |
| Super Trend (3,10): | 180.25 | |
| Zig ZAG (10): | 184.12 | |
| VORTEX (21): | 1.0100 | |
| Stochastique (14,3,5): | 51.47 | |
| TEMA (21): | 183.49 | |
| Williams %R (14): | -33.26 | |
| Chande Momentum Oscillator (20): | 0.19 | |
| Repulse (5,40,3): | 0.8900 | |
| ROCnROLL: | -1 | |
| TRIX (15,9): | -0.1300 | |
| Courbe Coppock: | 0.04 |
| MA7: | 186.23 | |
| MA20: | 198.60 | |
| MA50: | 205.71 | |
| MA100: | 216.35 | |
| MAexp7: | 183.75 | |
| MAexp20: | 184.20 | |
| MAexp50: | 188.14 | |
| MAexp100: | 193.17 | |
| Price / MA7: | -1.03% | |
| Price / MA20: | -7.20% | |
| Price / MA50: | -10.40% | |
| Price / MA100: | -14.81% | |
| Price / MAexp7: | +0.30% | |
| Price / MAexp20: | +0.06% | |
| Price / MAexp50: | -2.04% | |
| Price / MAexp100: | -4.59% |
News
The last news published on AMERICAN TOWER CORP. at the time of the generation of this analysis was as follows:
- Investor Network: American Tower Corporation to Host Earnings Call
-
 American Tower
-
American Tower
-
Carson Block: American Tower Got in Under the Wire
About author
Online


Add a comment
Comments
0 comments on the analysis AMERICAN TOWER CORP. - 1H