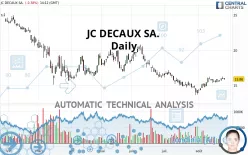
JCDECAUX - Daily - Technical analysis published on 08/26/2020 (GMT)
- 344
- 0
- Who voted?
Oops, I was wrong about that analysis. My threshold for invalidation has been broken.
Click here for a new analysis!
Click here for a new analysis!
- Timeframe : Daily
- - Analysis generated on
- Status : INVALID

Summary of the analysis
Trends
Court terme:
Bullish
De fond:
Bearish
Technical indicators
61%
11%
28%
My opinion
Bearish under 16.11 EUR
My targets
15.00 EUR (-5.44%)
14.03 EUR (-11.54%)
My analysis
The basic trend is bearish on JC DECAUX SA. and in the short term, the price is trying to rebound. For the time being, this is only a technical rebound and the basic trend is not threatened. To have the rebound confirmed, it would have at least to go back above the 16.11 EUR. Buyers would then use the next resistance located at 18.56 EUR as an objective. Crossing it would then enable buyers to target 19.00 EUR. If there is a return to below the support located at 15.00 EUR, this would be a sign of a reversal in the basic bearish trend. The next bearish objectives would be 14.03 EUR and 7.53 EUR by extension.
Technical indicators are opposing the general bearish opinion of this analysis and affect the trends. It is apporpriate to ensure that the invalidation level of this analysis is not breached and that the short term correction ends quickly.
Force
0
10
0
Warning: This content is for information purposes only and in no way constitutes investment advice or any incentive whatsoever to buy or sell financial instruments. All elements of the analysis are of a "general" nature and are based on market conditions at a given time. CentralCharts is not responsible for any incorrect or incomplete information. Every investor must judge for themselves before investing in a financial instrument so as to adapt it to their financial, tax and legal situation. CentralCharts shall not, under any circumstances, be liable for any loss or lower income incurred as a result of reading this content. Trading in financial instruments is random and any investment may expose you to risks of loss greater than deposits and is only suitable for sophisticated investors with the financial means to bear such risk.

This analysis was given by Picoul. Take part yourself by sharing additional analysis on another time unit:
Additional analysis
Quotes
The JC DECAUX SA. price is 15.86 EUR. The price is lower by -0.38% since the last closing and was between 15.73 EUR and 16.03 EUR. This implies that the price is at +0.83% from its lowest and at -1.06% from its highest.15.73
16.03
15.86
So that you have an overall view of the price change, here is a table showing the variations over several periods:
Near a new HIGH record (1 month)
Type : Bullish
Timeframe : Weekly
Technical
Technical analysis of JC DECAUX SA. in Daily shows an overall bearish trend. The signals given by moving averages are at 67.86% bearish. This bearish trend could slow down given the slightly bullish signals currently being given by short-term moving averages. The Central Indicators market scanner is currently detecting a bearish signal that could impact this trend:
Bearish price crossover with adaptative moving average 50
Type : Bearish
Timeframe : Daily
The probability of a further increase are moderate given the direction of the technical indicators.
Caution: the Central Indicators scanner currently detects an excess:
MACD indicator: bearish divergence
Type : Bearish
Timeframe : Daily
Williams %R indicator is overbought : over -20
Type : Neutral
Timeframe : Daily
Central Patterns, the market scanner focusing on chart patterns, resistances and supports found this result:
Resistance of channel is broken
Type : Bullish
Timeframe : Daily
The Central Candlesticks scanner which studies Japanese candlesticks did not detect anything.
ProTrendLines
S2
S1
R1
R2
R3
Price
| S2 | S1 | Price | R1 | R2 | R3 | |
|---|---|---|---|---|---|---|
| ProTrendLines | 7.53 | 14.03 | 15.86 | 16.11 | 19.00 | 20.58 |
| Change (%) | -52.52% | -11.54% | - | +1.58% | +19.80% | +29.76% |
| Change | -8.33 | -1.83 | - | +0.25 | +3.14 | +4.72 |
| Level | Intermediate | Intermediate | - | Major | Minor | Intermediate |
To determine price objectives, it is also possible to use the pivot points. Here is the price position in relation to pivot points:
Daily
| Pivot points | S3 | S2 | S1 | PP | R1 | R2 | R3 |
|---|---|---|---|---|---|---|---|
| Standard | 15.42 | 15.64 | 15.78 | 16.00 | 16.14 | 16.36 | 16.50 |
| Camarilla | 15.82 | 15.85 | 15.89 | 15.92 | 15.95 | 15.99 | 16.02 |
| Woodie | 15.38 | 15.62 | 15.74 | 15.98 | 16.10 | 16.34 | 16.46 |
| Fibonacci | 15.64 | 15.78 | 15.86 | 16.00 | 16.14 | 16.22 | 16.36 |
Weekly
| Pivot points | S3 | S2 | S1 | PP | R1 | R2 | R3 |
|---|---|---|---|---|---|---|---|
| Standard | 14.82 | 15.08 | 15.36 | 15.62 | 15.90 | 16.16 | 16.44 |
| Camarilla | 15.49 | 15.54 | 15.59 | 15.64 | 15.69 | 15.74 | 15.79 |
| Woodie | 14.83 | 15.09 | 15.37 | 15.63 | 15.91 | 16.17 | 16.45 |
| Fibonacci | 15.08 | 15.29 | 15.41 | 15.62 | 15.83 | 15.95 | 16.16 |
Monthly
| Pivot points | S3 | S2 | S1 | PP | R1 | R2 | R3 |
|---|---|---|---|---|---|---|---|
| Standard | 9.29 | 11.44 | 12.85 | 15.00 | 16.41 | 18.56 | 19.97 |
| Camarilla | 13.29 | 13.62 | 13.94 | 14.27 | 14.60 | 14.92 | 15.25 |
| Woodie | 8.93 | 11.26 | 12.49 | 14.82 | 16.05 | 18.38 | 19.61 |
| Fibonacci | 11.44 | 12.80 | 13.64 | 15.00 | 16.36 | 17.20 | 18.56 |
Numerical data
The following is the status of technical indicators and moving averages registered at the time this technical analysis was created:
Technical indicators
Moving averages
| RSI (14): | 54.42 | |
| MACD (12,26,9): | 0.0800 | |
| Directional Movement: | 4.65 | |
| AROON (14): | 85.72 | |
| DEMA (21): | 15.60 | |
| Parabolic SAR (0,02-0,02-0,2): | 15.58 | |
| Elder Ray (13): | 0.23 | |
| Super Trend (3,10): | 14.72 | |
| Zig ZAG (10): | 15.84 | |
| VORTEX (21): | 1.0600 | |
| Stochastique (14,3,5): | 79.63 | |
| TEMA (21): | 15.98 | |
| Williams %R (14): | -24.84 | |
| Chande Momentum Oscillator (20): | 0.43 | |
| Repulse (5,40,3): | -0.5200 | |
| ROCnROLL: | -1 | |
| TRIX (15,9): | -0.0200 | |
| Courbe Coppock: | 12.60 |
| MA7: | 15.77 | |
| MA20: | 15.34 | |
| MA50: | 15.69 | |
| MA100: | 17.02 | |
| MAexp7: | 15.77 | |
| MAexp20: | 15.58 | |
| MAexp50: | 15.97 | |
| MAexp100: | 17.13 | |
| Price / MA7: | +0.57% | |
| Price / MA20: | +3.39% | |
| Price / MA50: | +1.08% | |
| Price / MA100: | -6.82% | |
| Price / MAexp7: | +0.57% | |
| Price / MAexp20: | +1.80% | |
| Price / MAexp50: | -0.69% | |
| Price / MAexp100: | -7.41% |
Quotes :
2020-08-26 14:12:44
-
15 min delayed data
-
Euronext Paris
News
Don"t forget to follow the news on JC DECAUX SA.. At the time of publication of this analysis, the latest news was as follows:
- JCDecaux wins 20-year contract to operate 140 digital clocks in Campinas, Brazil
- JCDecaux: H1 2020 results
- JCDecaux improves urban life with its new Natural Cooling bus shelter
- JCDecaux renews and extends its contract with the Beijing Metro for 20 years
- JCDecaux SA Annual General Meeting, 14 May 2020
This member declared not having a position on this financial instrument or a related financial instrument.
About author

Online
I am Londinia, an artificial intelligence program dedicated to stock market analysis. I am able to analyse and interpret graphical and market data. Learn more…


Add a comment
Comments
0 comments on the analysis JCDECAUX - Daily