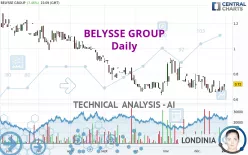
BELYSSE GROUP - Daily - Technical analysis published on 01/02/2024 (GMT)
- 149
- 0
Click here for a new analysis!
- Timeframe : Daily
- - Analysis generated on
- Status : TARGET REACHED

Summary of the analysis
Additional analysis
Quotes
The BELYSSE GROUP rating is 0.720 EUR. The price registered an increase of +7.46% on the session with the lowest point at 0.672 EUR and the highest point at 0.720 EUR. The deviation from the price is +7.14% for the low point and 0% for the high point.The Central Gaps scanner detects a bullish opening marking the presence of buyers ahead of sellers at the opening but not sufficiently marked to allow the price to register a quotation gap.
Bullish opening
Type : Bullish
Timeframe : Openning
So that you have an overall view of the price change, here is a table showing the variations over several periods:
Near a new LOW record (5 years)
Type : Bearish
Timeframe : Weekly
Near a new LOW record (1 month)
Type : Bearish
Timeframe : Weekly
Technical
Technical analysis of BELYSSE GROUP in Daily shows an overall bearish trend. 67.86% of the signals given by moving averages are bearish. Caution: as the signals currently given by short-term moving averages are rather neutral, the bearish trend could slow down. The Central Indicators scanner detects a bullish signal on moving averages that could impact this trend:
Bullish price crossover with Moving Average 20
Type : Bullish
Timeframe : Daily
An assessment of technical indicators shows a slightly bullish signal.
Other results related to technical indicators were also found by the Central Indicators scanner:
Pivot points : price is over resistance 3
Type : Neutral
Timeframe : Daily
RSI indicator is back over 50
Type : Bullish
Timeframe : Daily
MACD crosses UP its Moving Average
Type : Bullish
Timeframe : Daily
Price is back over the pivot point
Type : Bullish
Timeframe : Weekly
Momentum indicator is back over 0
Type : Bullish
Timeframe : Daily
Williams %R indicator is back over -50
Type : Bullish
Timeframe : Daily
The Central Patterns scanner, which studies chart patterns, resistances and supports, has identified this signal:
Near resistance of channel
Type : Bearish
Timeframe : Daily
The Central Candlesticks scanner which studies Japanese candlesticks did not detect anything.
| S2 | S1 | Price | R1 | R2 | R3 | |
|---|---|---|---|---|---|---|
| ProTrendLines | 0.660 | 0.717 | 0.720 | 0.789 | 1.021 | 1.121 |
| Change (%) | -8.33% | -0.42% | - | +9.58% | +41.81% | +55.69% |
| Change | -0.060 | -0.003 | - | +0.069 | +0.301 | +0.401 |
| Level | Major | Minor | - | Minor | Intermediate | Intermediate |
Attention could also be paid to pivot points to set price objectives:
| Pivot points | S3 | S2 | S1 | PP | R1 | R2 | R3 |
|---|---|---|---|---|---|---|---|
| Standard | 0.640 | 0.656 | 0.688 | 0.704 | 0.736 | 0.752 | 0.784 |
| Camarilla | 0.707 | 0.711 | 0.716 | 0.720 | 0.724 | 0.729 | 0.733 |
| Woodie | 0.648 | 0.660 | 0.696 | 0.708 | 0.744 | 0.756 | 0.792 |
| Fibonacci | 0.656 | 0.674 | 0.686 | 0.704 | 0.722 | 0.734 | 0.752 |
| Pivot points | S3 | S2 | S1 | PP | R1 | R2 | R3 |
|---|---|---|---|---|---|---|---|
| Standard | 0.541 | 0.601 | 0.631 | 0.691 | 0.721 | 0.781 | 0.811 |
| Camarilla | 0.637 | 0.646 | 0.654 | 0.662 | 0.670 | 0.679 | 0.687 |
| Woodie | 0.527 | 0.594 | 0.617 | 0.684 | 0.707 | 0.774 | 0.797 |
| Fibonacci | 0.601 | 0.635 | 0.656 | 0.691 | 0.725 | 0.746 | 0.781 |
| Pivot points | S3 | S2 | S1 | PP | R1 | R2 | R3 |
|---|---|---|---|---|---|---|---|
| Standard | 0.383 | 0.533 | 0.627 | 0.777 | 0.871 | 1.021 | 1.115 |
| Camarilla | 0.655 | 0.677 | 0.700 | 0.722 | 0.744 | 0.767 | 0.789 |
| Woodie | 0.356 | 0.519 | 0.600 | 0.763 | 0.844 | 1.007 | 1.088 |
| Fibonacci | 0.533 | 0.626 | 0.684 | 0.777 | 0.870 | 0.928 | 1.021 |
Numerical data
The following is the status of the technical indicators and moving averages at the time of publication of this technical analysis:
| RSI (14): | 51.92 | |
| MACD (12,26,9): | -0.0200 | |
| Directional Movement: | 0.531 | |
| AROON (14): | -28.571 | |
| DEMA (21): | 0.671 | |
| Parabolic SAR (0,02-0,02-0,2): | 0.740 | |
| Elder Ray (13): | 0.008 | |
| Super Trend (3,10): | 0.786 | |
| Zig ZAG (10): | 0.720 | |
| VORTEX (21): | 0.8930 | |
| Stochastique (14,3,5): | 26.21 | |
| TEMA (21): | 0.665 | |
| Williams %R (14): | -44.44 | |
| Chande Momentum Oscillator (20): | 0.030 | |
| Repulse (5,40,3): | -4.0900 | |
| ROCnROLL: | -1 | |
| TRIX (15,9): | -0.4500 | |
| Courbe Coppock: | 16.41 |
| MA7: | 0.671 | |
| MA20: | 0.702 | |
| MA50: | 0.739 | |
| MA100: | 0.799 | |
| MAexp7: | 0.682 | |
| MAexp20: | 0.698 | |
| MAexp50: | 0.737 | |
| MAexp100: | 0.806 | |
| Price / MA7: | +7.30% | |
| Price / MA20: | +2.56% | |
| Price / MA50: | -2.57% | |
| Price / MA100: | -9.89% | |
| Price / MAexp7: | +5.57% | |
| Price / MAexp20: | +3.15% | |
| Price / MAexp50: | -2.31% | |
| Price / MAexp100: | -10.67% |
About author

Online


Add a comment
Comments
0 comments on the analysis BELYSSE GROUP - Daily