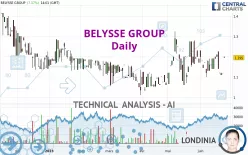
BELYSSE GROUP - Daily - Technical analysis published on 06/28/2023 (GMT)
- 112
- 0
Click here for a new analysis!
- Timeframe : Daily
- - Analysis generated on
- Status : INVALID

Summary of the analysis
Additional analysis
Quotes
The BELYSSE GROUP price is 1.195 EUR. The price registered an increase of +7.18% on the session and was between 1.195 EUR and 1.200 EUR. This implies that the price is at 0% from its lowest and at -0.42% from its highest.The Central Gaps scanner detects the formation of a bullish gap marking the strong presence of buyers against sellers at the opening. This formed a quotation gap.
Opening Gap UP
Type : Bullish
Timeframe : Openning
So that you have an overall view of the price change, here is a table showing the variations over several periods:
Technical
A technical analysis in Daily of this BELYSSE GROUP chart shows a strongly bullish trend. 85.71% of the signals given by moving averages are bullish. The overall trend is supported by the strong bullish signals from short-term moving averages. An assessment of moving averages reveals several bullish signals that could impact this trend:
Bullish price crossover with Moving Average 20
Type : Bullish
Timeframe : Daily
Bullish price crossover with Moving Average 50
Type : Bullish
Timeframe : Daily
Bullish price crossover with Moving Average 100
Type : Bullish
Timeframe : Daily
Bullish price crossover with adaptative moving average 20
Type : Bullish
Timeframe : Daily
Bullish price crossover with adaptative moving average 50
Type : Bullish
Timeframe : Daily
Bullish price crossover with adaptative moving average 100
Type : Bullish
Timeframe : Daily
In fact, 11 technical indicators on 18 studied are currently positioned bullish. Central Indicators, the scanner specialised in technical indicators, has identified these signals:
Pivot points : price is over resistance 1
Type : Neutral
Timeframe : Weekly
Pivot points : price is over resistance 3
Type : Neutral
Timeframe : Daily
RSI indicator is back over 50
Type : Bullish
Timeframe : Daily
Ichimoku : price is over the cloud
Type : Bullish
Timeframe : Daily
Momentum indicator is back over 0
Type : Bullish
Timeframe : Daily
Williams %R indicator is back over -50
Type : Bullish
Timeframe : Daily
Central Patterns, the market scanner focusing on chart patterns, resistances and supports found this result:
Near resistance of channel
Type : Bearish
Timeframe : Daily
The Central Candlesticks scanner, specialised in Japanese candlesticks, did not identify any signals.
| S3 | S2 | S1 | Price | R1 | R2 | R3 | |
|---|---|---|---|---|---|---|---|
| ProTrendLines | 0.792 | 1.024 | 1.140 | 1.195 | 1.291 | 1.415 | 1.520 |
| Change (%) | -33.72% | -14.31% | -4.60% | - | +8.03% | +18.41% | +27.20% |
| Change | -0.403 | -0.171 | -0.055 | - | +0.096 | +0.220 | +0.325 |
| Level | Minor | Major | Intermediate | - | Intermediate | Minor | Minor |
Pivot points can also be used to set your price objectives. Here is the price situation in relation to pivot points:
| Pivot points | S3 | S2 | S1 | PP | R1 | R2 | R3 |
|---|---|---|---|---|---|---|---|
| Standard | 1.188 | 1.192 | 1.193 | 1.197 | 1.198 | 1.202 | 1.203 |
| Camarilla | 1.194 | 1.194 | 1.195 | 1.195 | 1.196 | 1.196 | 1.196 |
| Woodie | 1.188 | 1.191 | 1.193 | 1.196 | 1.198 | 1.201 | 1.203 |
| Fibonacci | 1.192 | 1.194 | 1.195 | 1.197 | 1.199 | 1.200 | 1.202 |
| Pivot points | S3 | S2 | S1 | PP | R1 | R2 | R3 |
|---|---|---|---|---|---|---|---|
| Standard | 0.957 | 1.033 | 1.072 | 1.148 | 1.187 | 1.263 | 1.302 |
| Camarilla | 1.078 | 1.089 | 1.100 | 1.110 | 1.121 | 1.131 | 1.142 |
| Woodie | 0.938 | 1.024 | 1.053 | 1.139 | 1.168 | 1.254 | 1.283 |
| Fibonacci | 1.033 | 1.077 | 1.104 | 1.148 | 1.192 | 1.219 | 1.263 |
| Pivot points | S3 | S2 | S1 | PP | R1 | R2 | R3 |
|---|---|---|---|---|---|---|---|
| Standard | 0.780 | 0.920 | 1.045 | 1.185 | 1.310 | 1.450 | 1.575 |
| Camarilla | 1.097 | 1.121 | 1.146 | 1.170 | 1.194 | 1.219 | 1.243 |
| Woodie | 0.773 | 0.916 | 1.038 | 1.181 | 1.303 | 1.446 | 1.568 |
| Fibonacci | 0.920 | 1.021 | 1.084 | 1.185 | 1.286 | 1.349 | 1.450 |
Numerical data
The following is the status of technical indicators and moving averages registered at the time this technical analysis was created:
| RSI (14): | 54.47 | |
| MACD (12,26,9): | -0.0030 | |
| Directional Movement: | 9.341 | |
| AROON (14): | 57.143 | |
| DEMA (21): | 1.158 | |
| Parabolic SAR (0,02-0,02-0,2): | 1.241 | |
| Elder Ray (13): | 0.041 | |
| Super Trend (3,10): | 1.229 | |
| Zig ZAG (10): | 1.195 | |
| VORTEX (21): | 0.9150 | |
| Stochastique (14,3,5): | 32.00 | |
| TEMA (21): | 1.148 | |
| Williams %R (14): | -24.00 | |
| Chande Momentum Oscillator (20): | 0.075 | |
| Repulse (5,40,3): | -2.5280 | |
| ROCnROLL: | 1 | |
| TRIX (15,9): | 0.0050 | |
| Courbe Coppock: | 2.28 |
| MA7: | 1.154 | |
| MA20: | 1.165 | |
| MA50: | 1.150 | |
| MA100: | 1.142 | |
| MAexp7: | 1.153 | |
| MAexp20: | 1.159 | |
| MAexp50: | 1.156 | |
| MAexp100: | 1.176 | |
| Price / MA7: | +3.55% | |
| Price / MA20: | +2.58% | |
| Price / MA50: | +3.91% | |
| Price / MA100: | +4.64% | |
| Price / MAexp7: | +3.64% | |
| Price / MAexp20: | +3.11% | |
| Price / MAexp50: | +3.37% | |
| Price / MAexp100: | +1.62% |
About author

Online


Add a comment
Comments
0 comments on the analysis BELYSSE GROUP - Daily