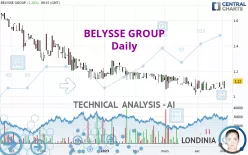
BELYSSE GROUP - Daily - Technical analysis published on 05/03/2023 (GMT)
- 145
- 0
Click here for a new analysis!
- Timeframe : Daily
- - Analysis generated on
- Status : TARGET REACHED

Summary of the analysis

Additional analysis
Quotes
The BELYSSE GROUP rating is 1.120 EUR. On the day, this instrument gained +5.66% with the lowest point at 1.065 EUR and the highest point at 1.120 EUR. The deviation from the price is +5.16% for the low point and 0% for the high point.The Central Gaps scanner detects the formation of a bearish gap marking the strong presence of sellers ahead of buyers at the opening. This formed a quotation gap.
Opening Gap DOWN
Type : Bearish
Timeframe : Openning
So that you have an overall view of the price change, here is a table showing the variations over several periods:
Near a new LOW record (1 month)
Type : Bearish
Timeframe : Weekly
Technical
A technical analysis in Daily of this BELYSSE GROUP chart shows a slightly bearish trend. 57.14% of the signals given by moving averages are bearish. Caution: the strong bullish signals currently being given by short-term moving averages indicate that this slightly bearish trend could quickly be reversed. The Central Indicators market scanner is currently detecting several bullish signals that could impact this trend:
Bullish trend reversal : Moving Average 20
Type : Bullish
Timeframe : Daily
Bullish trend reversal : adaptative moving average 20
Type : Bullish
Timeframe : Daily
Moving Average bullish crossovers : AMA50 & AMA100
Type : Bullish
Timeframe : Daily
Bullish price crossover with Moving Average 50
Type : Bullish
Timeframe : Daily
In fact, 12 technical indicators on 18 studied are currently positioned bullish. But beware of excesses. The Central Indicators scanner currently detects this:
Williams %R indicator is overbought : over -20
Type : Neutral
Timeframe : Daily
Pivot points : price is over resistance 1
Type : Neutral
Timeframe : Daily
Pivot points : price is over resistance 1
Type : Neutral
Timeframe : Weekly
Momentum indicator is back over 0
Type : Bullish
Timeframe : Daily
Central Patterns, the scanner specializing in chart patterns, did not identify any signals.
No result was found by the Central Candlesticks scanner on Japanese candlesticks.
| S2 | S1 | Price | R1 | R2 | R3 | |
|---|---|---|---|---|---|---|
| ProTrendLines | 0.792 | 1.024 | 1.120 | 1.140 | 1.288 | 1.505 |
| Change (%) | -29.29% | -8.57% | - | +1.79% | +15.00% | +34.38% |
| Change | -0.328 | -0.096 | - | +0.020 | +0.168 | +0.385 |
| Level | Minor | Major | - | Intermediate | Intermediate | Minor |
Attention could also be paid to pivot points to set price objectives:
| Pivot points | S3 | S2 | S1 | PP | R1 | R2 | R3 |
|---|---|---|---|---|---|---|---|
| Standard | 1.062 | 1.078 | 1.087 | 1.103 | 1.112 | 1.128 | 1.137 |
| Camarilla | 1.088 | 1.090 | 1.093 | 1.095 | 1.097 | 1.100 | 1.102 |
| Woodie | 1.058 | 1.076 | 1.083 | 1.101 | 1.108 | 1.126 | 1.133 |
| Fibonacci | 1.078 | 1.088 | 1.094 | 1.103 | 1.113 | 1.119 | 1.128 |
| Pivot points | S3 | S2 | S1 | PP | R1 | R2 | R3 |
|---|---|---|---|---|---|---|---|
| Standard | 0.993 | 1.027 | 1.043 | 1.077 | 1.093 | 1.127 | 1.143 |
| Camarilla | 1.046 | 1.051 | 1.055 | 1.060 | 1.065 | 1.069 | 1.074 |
| Woodie | 0.985 | 1.023 | 1.035 | 1.073 | 1.085 | 1.123 | 1.135 |
| Fibonacci | 1.027 | 1.046 | 1.058 | 1.077 | 1.096 | 1.108 | 1.127 |
| Pivot points | S3 | S2 | S1 | PP | R1 | R2 | R3 |
|---|---|---|---|---|---|---|---|
| Standard | 0.923 | 0.977 | 1.018 | 1.072 | 1.113 | 1.167 | 1.208 |
| Camarilla | 1.034 | 1.043 | 1.051 | 1.060 | 1.069 | 1.077 | 1.086 |
| Woodie | 0.918 | 0.974 | 1.013 | 1.069 | 1.108 | 1.164 | 1.203 |
| Fibonacci | 0.977 | 1.013 | 1.035 | 1.072 | 1.108 | 1.130 | 1.167 |
Numerical data
The following are the details of the technical indicators and moving averages that were collected to generate this technical analysis:
| RSI (14): | 55.41 | |
| MACD (12,26,9): | -0.0040 | |
| Directional Movement: | 0.826 | |
| AROON (14): | 7.143 | |
| DEMA (21): | 1.078 | |
| Parabolic SAR (0,02-0,02-0,2): | 1.035 | |
| Elder Ray (13): | 0.007 | |
| Super Trend (3,10): | 1.165 | |
| Zig ZAG (10): | 1.120 | |
| VORTEX (21): | 0.8630 | |
| Stochastique (14,3,5): | 59.52 | |
| TEMA (21): | 1.088 | |
| Williams %R (14): | 0.00 | |
| Chande Momentum Oscillator (20): | 0.020 | |
| Repulse (5,40,3): | 3.5130 | |
| ROCnROLL: | -1 | |
| TRIX (15,9): | -0.1300 | |
| Courbe Coppock: | 1.55 |
| MA7: | 1.085 | |
| MA20: | 1.079 | |
| MA50: | 1.109 | |
| MA100: | 1.154 | |
| MAexp7: | 1.090 | |
| MAexp20: | 1.087 | |
| MAexp50: | 1.112 | |
| MAexp100: | 1.195 | |
| Price / MA7: | +3.23% | |
| Price / MA20: | +3.80% | |
| Price / MA50: | +0.99% | |
| Price / MA100: | -2.95% | |
| Price / MAexp7: | +2.75% | |
| Price / MAexp20: | +3.04% | |
| Price / MAexp50: | +0.72% | |
| Price / MAexp100: | -6.28% |
About author
Online


Add a comment
Comments
0 comments on the analysis BELYSSE GROUP - Daily