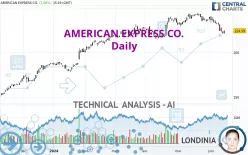
AMERICAN EXPRESS CO. - Daily - Technical analysis published on 06/14/2024 (GMT)
- 149
- 0
Click here for a new analysis!
- Timeframe : Daily
- - Analysis generated on
- Status : LEVEL MAINTAINED

Summary of the analysis

Additional analysis
Quotes
The AMERICAN EXPRESS CO. price is 224.59 USD. The price has increased by +1.08% since the last closing and was between 221.34 USD and 224.66 USD. This implies that the price is at +1.47% from its lowest and at -0.03% from its highest.The Central Gaps scanner detects a bearish opening. A small advantage for sellers in the very short term.
Bearish opening
Type : Bearish
Timeframe : Openning
A study of price movements over other periods shows the following variations:
Near a new HIGH record (5 years)
Type : Bullish
Timeframe : Weekly
Near a new LOW record (1 month)
Type : Bearish
Timeframe : Weekly
Technical
Technical analysis of this Daily chart of AMERICAN EXPRESS CO. indicates that the overall trend is slightly bullish. 57.14% of the signals given by moving averages are bullish. Caution: the strong bearish signals currently being given by short-term moving averages indicate that this slightly bullish trend could be reversed. An assessment of moving averages reveals a bullish signal that could impact this trend:
Bullish price crossover with Moving Average 100
Type : Bullish
Timeframe : Daily
In fact, 10 technical indicators on 18 studied are currently positioned bearish. Caution: the Central Indicators scanner currently detects an excess:
CCI indicator is oversold : under -100
Type : Neutral
Timeframe : Daily
Previous candle closed under Bollinger bands
Type : Neutral
Timeframe : Daily
Williams %R indicator is oversold : under -80
Type : Neutral
Timeframe : Daily
Pivot points : price is over resistance 1
Type : Neutral
Timeframe : Daily
Pivot points : price is under support 3
Type : Neutral
Timeframe : Weekly
Central Patterns, the market scanner focusing on chart patterns, resistances and supports found these results:
Near horizontal support
Type : Bullish
Timeframe : Daily
Support of channel is broken
Type : Bearish
Timeframe : Daily
The presence of a bullish Japanese candlestick pattern detected by Central Candlesticks that could cause a very short term rebound was also detected:
Bullish engulfing lines
Type : Bullish
Timeframe : Daily
| S3 | S2 | S1 | Price | R1 | |
|---|---|---|---|---|---|
| ProTrendLines | 179.04 | 193.76 | 217.74 | 224.59 | 242.99 |
| Change (%) | -20.28% | -13.73% | -3.05% | - | +8.19% |
| Change | -45.55 | -30.83 | -6.85 | - | +18.40 |
| Level | Major | Major | Major | - | Major |
Pivot points can also be used to set your price objectives. Here is the price situation in relation to pivot points:
| Pivot points | S3 | S2 | S1 | PP | R1 | R2 | R3 |
|---|---|---|---|---|---|---|---|
| Standard | 217.69 | 219.22 | 220.70 | 222.23 | 223.71 | 225.24 | 226.72 |
| Camarilla | 221.36 | 221.64 | 221.91 | 222.19 | 222.47 | 222.74 | 223.02 |
| Woodie | 217.68 | 219.21 | 220.69 | 222.22 | 223.70 | 225.23 | 226.71 |
| Fibonacci | 219.22 | 220.37 | 221.08 | 222.23 | 223.38 | 224.09 | 225.24 |
| Pivot points | S3 | S2 | S1 | PP | R1 | R2 | R3 |
|---|---|---|---|---|---|---|---|
| Standard | 219.48 | 225.60 | 229.13 | 235.25 | 238.78 | 244.90 | 248.43 |
| Camarilla | 230.02 | 230.90 | 231.79 | 232.67 | 233.56 | 234.44 | 235.32 |
| Woodie | 218.20 | 224.95 | 227.85 | 234.60 | 237.50 | 244.25 | 247.15 |
| Fibonacci | 225.60 | 229.28 | 231.56 | 235.25 | 238.93 | 241.21 | 244.90 |
| Pivot points | S3 | S2 | S1 | PP | R1 | R2 | R3 |
|---|---|---|---|---|---|---|---|
| Standard | 216.00 | 222.57 | 231.28 | 237.85 | 246.56 | 253.13 | 261.84 |
| Camarilla | 235.80 | 237.20 | 238.60 | 240.00 | 241.40 | 242.80 | 244.20 |
| Woodie | 217.08 | 223.11 | 232.36 | 238.39 | 247.64 | 253.67 | 262.92 |
| Fibonacci | 222.57 | 228.40 | 232.01 | 237.85 | 243.68 | 247.29 | 253.13 |
Numerical data
The following is the status of technical indicators and moving averages registered at the time this technical analysis was created:
| RSI (14): | 34.90 | |
| MACD (12,26,9): | -2.6900 | |
| Directional Movement: | -19.95 | |
| AROON (14): | -57.15 | |
| DEMA (21): | 229.59 | |
| Parabolic SAR (0,02-0,02-0,2): | 231.92 | |
| Elder Ray (13): | -7.24 | |
| Super Trend (3,10): | 235.00 | |
| Zig ZAG (10): | 224.27 | |
| VORTEX (21): | 0.7300 | |
| Stochastique (14,3,5): | 10.08 | |
| TEMA (21): | 225.18 | |
| Williams %R (14): | -83.76 | |
| Chande Momentum Oscillator (20): | -11.88 | |
| Repulse (5,40,3): | -1.1000 | |
| ROCnROLL: | 2 | |
| TRIX (15,9): | -0.0400 | |
| Courbe Coppock: | 9.75 |
| MA7: | 227.61 | |
| MA20: | 234.74 | |
| MA50: | 232.39 | |
| MA100: | 223.61 | |
| MAexp7: | 227.07 | |
| MAexp20: | 232.00 | |
| MAexp50: | 230.66 | |
| MAexp100: | 220.94 | |
| Price / MA7: | -1.33% | |
| Price / MA20: | -4.32% | |
| Price / MA50: | -3.36% | |
| Price / MA100: | +0.44% | |
| Price / MAexp7: | -1.09% | |
| Price / MAexp20: | -3.19% | |
| Price / MAexp50: | -2.63% | |
| Price / MAexp100: | +1.65% |
News
The last news published on AMERICAN EXPRESS CO. at the time of the generation of this analysis was as follows:
- HQ Announces Integration With American Express for an Enhanced Ride Payment Experience
- CLEAR AND AMERICAN EXPRESS RENEW PARTNERSHIP TO PROVIDE PREMIUM TRAVEL EXPERIENCES AT AIRPORTS TO CARD MEMBERS
- Evolve Bank & Trust Partners With Neon Money Club to Launch the Cream Card on the American Express Network
-
 Look ahead: UK and German consumer confidence; BOJ minutes; Core PCE; American Express
- Thinking about trading options or stock in MDC Holdings, Applied Digital, Toll Brothers, Netflix, or American Express?
About author
Online


Add a comment
Comments
0 comments on the analysis AMERICAN EXPRESS CO. - Daily