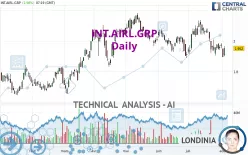
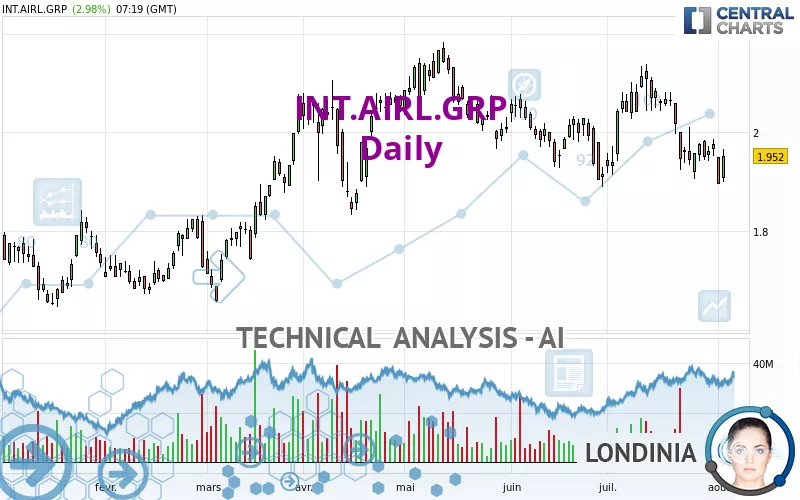
INT.AIRL.GRP - Daily - Technical analysis published on 08/02/2024 (GMT)
- 217
- 0
Click here for a new analysis!
- Timeframe : Daily
- - Analysis generated on
- Status : INVALID
Summary of the analysis

Additional analysis
Quotes
The INT.AIRL.GRP price is 1.9505 EUR. On the day, this instrument gained +2.90% and was traded between 1.8990 EUR and 1.9660 EUR over the period. The price is currently at +2.71% from its lowest and -0.79% from its highest.The Central Gaps scanner detects a bullish opening. A small advantage for buyers in the very short term.
Bullish opening
Type : Bullish
Timeframe : Openning
A study of price movements over other periods shows the following variations:
New LOW record (1 month)
Type : Bearish
Timeframe : Weekly
Technical
Technical analysis of INT.AIRL.GRP in Daily shows an overall bearish trend. 67.86% of the signals given by moving averages are bearish. This bearish trend is supported by the strong bearish signals given by short-term moving averages. The Central Indicators market scanner is currently detecting a bearish signal that could impact this trend:
Moving Average bearish crossovers : MA50 & MA100
Type : Bearish
Timeframe : Daily
The technical indicators are generally neutral. They do not provide relevant information on the direction of future price movements.
Caution: the Central Indicators scanner currently detects an excess:
RSI indicator: bullish divergence
Type : Bullish
Timeframe : Daily
Williams %R indicator is oversold : under -80
Type : Neutral
Timeframe : Daily
Pivot points : price is over resistance 1
Type : Neutral
Timeframe : Daily
Pivot points : price is under support 1
Type : Neutral
Timeframe : Weekly
The Central Patterns scanner, which studies chart patterns, resistances and supports, has identified this signal:
Near support of channel
Type : Bullish
Timeframe : Daily
Central Candlesticks, the scanner specialised in Japanese candlesticks, detects a bearish signal that could support the hypothesis of a small drop in the very short term:
Downside Tasuki gap
Type : Bearish
Timeframe : Daily
| S3 | S2 | S1 | Price | R1 | R2 | R3 | |
|---|---|---|---|---|---|---|---|
| ProTrendLines | 1.7467 | 1.8222 | 1.9045 | 1.9505 | 1.9641 | 2.1150 | 2.1670 |
| Change (%) | -10.45% | -6.58% | -2.36% | - | +0.70% | +8.43% | +11.10% |
| Change | -0.2038 | -0.1283 | -0.0460 | - | +0.0136 | +0.1645 | +0.2165 |
| Level | Minor | Minor | Intermediate | - | Major | Intermediate | Intermediate |
To determine price objectives, it is also possible to use the pivot points. Here is the price position in relation to pivot points:
| Pivot points | S3 | S2 | S1 | PP | R1 | R2 | R3 |
|---|---|---|---|---|---|---|---|
| Standard | 1.8215 | 1.8585 | 1.8770 | 1.9140 | 1.9325 | 1.9695 | 1.9880 |
| Camarilla | 1.8802 | 1.8853 | 1.8904 | 1.8955 | 1.9006 | 1.9057 | 1.9108 |
| Woodie | 1.8123 | 1.8539 | 1.8678 | 1.9094 | 1.9233 | 1.9649 | 1.9788 |
| Fibonacci | 1.8585 | 1.8797 | 1.8928 | 1.9140 | 1.9352 | 1.9483 | 1.9695 |
| Pivot points | S3 | S2 | S1 | PP | R1 | R2 | R3 |
|---|---|---|---|---|---|---|---|
| Standard | 1.8130 | 1.8595 | 1.9180 | 1.9645 | 2.0230 | 2.0695 | 2.1280 |
| Camarilla | 1.9476 | 1.9573 | 1.9669 | 1.9765 | 1.9861 | 1.9958 | 2.0054 |
| Woodie | 1.8190 | 1.8625 | 1.9240 | 1.9675 | 2.0290 | 2.0725 | 2.1340 |
| Fibonacci | 1.8595 | 1.8996 | 1.9244 | 1.9645 | 2.0046 | 2.0294 | 2.0695 |
| Pivot points | S3 | S2 | S1 | PP | R1 | R2 | R3 |
|---|---|---|---|---|---|---|---|
| Standard | 1.6360 | 1.7710 | 1.8690 | 2.0040 | 2.1020 | 2.2370 | 2.3350 |
| Camarilla | 1.9029 | 1.9243 | 1.9456 | 1.9670 | 1.9884 | 2.0097 | 2.0311 |
| Woodie | 1.6175 | 1.7618 | 1.8505 | 1.9948 | 2.0835 | 2.2278 | 2.3165 |
| Fibonacci | 1.7710 | 1.8600 | 1.9150 | 2.0040 | 2.0930 | 2.1480 | 2.2370 |
Numerical data
The following is the status of the technical indicators and moving averages at the time of publication of this technical analysis:
| RSI (14): | 46.10 | |
| MACD (12,26,9): | -0.0212 | |
| Directional Movement: | -6.3871 | |
| AROON (14): | -92.8571 | |
| DEMA (21): | 1.9607 | |
| Parabolic SAR (0,02-0,02-0,2): | 2.0441 | |
| Elder Ray (13): | -0.0384 | |
| Super Trend (3,10): | 2.0779 | |
| Zig ZAG (10): | 1.9525 | |
| VORTEX (21): | 0.7914 | |
| Stochastique (14,3,5): | 20.19 | |
| TEMA (21): | 1.9402 | |
| Williams %R (14): | -70.78 | |
| Chande Momentum Oscillator (20): | -0.1170 | |
| Repulse (5,40,3): | 0.0196 | |
| ROCnROLL: | 2 | |
| TRIX (15,9): | -0.0812 | |
| Courbe Coppock: | 12.20 |
| MA7: | 1.9517 | |
| MA20: | 2.0109 | |
| MA50: | 2.0038 | |
| MA100: | 2.0052 | |
| MAexp7: | 1.9518 | |
| MAexp20: | 1.9831 | |
| MAexp50: | 1.9977 | |
| MAexp100: | 1.9739 | |
| Price / MA7: | -0.06% | |
| Price / MA20: | -3.00% | |
| Price / MA50: | -2.66% | |
| Price / MA100: | -2.73% | |
| Price / MAexp7: | -0.07% | |
| Price / MAexp20: | -1.64% | |
| Price / MAexp50: | -2.36% | |
| Price / MAexp100: | -1.19% |
News
The latest news and videos published on INT.AIRL.GRP at the time of the analysis were as follows:
- KWE and IAG Cargo Agree to Expand Use of Sustainable Aviation Fuel
-
 10/05/24 - UK GDP, recession fears put to rest, FTSE highs, IAG Reports
- Sabre and IAG expand partnership with multi-year distribution agreement including NDC content
- BigCommerce Powers New IAG Loyalty Online Wine Store in Partnership with British Airways
-
Why Are IAG Shares Cheap?
About author
Online


Add a comment
Comments
0 comments on the analysis INT.AIRL.GRP - Daily