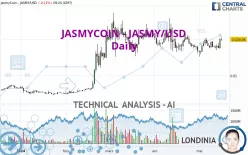
JASMYCOIN - JASMY/USD - Daily - Technical analysis published on 05/16/2024 (GMT)
- 143
- 0
Click here for a new analysis!
- Timeframe : Daily
- - Analysis generated on
- Status : TARGET REACHED

Summary of the analysis

Additional analysis
Quotes
The JASMYCOIN - JASMY/USD rating is 0.020106 USD. The price is lower by -0.12% since the last closing and was between 0.019682 USD and 0.020676 USD. This implies that the price is at +2.15% from its lowest and at -2.76% from its highest.A study of price movements over other periods shows the following variations:
Near a new HIGH record (1 month)
Type : Bullish
Timeframe : Weekly
Technical
Technical analysis of JASMYCOIN - JASMY/USD in Daily shows a strongly overall bullish trend. The signals given by the moving averages are 82.14% bullish. This strong bullish trend is confirmed by the strong signals currently being given by short-term moving averages. An assessment of moving averages reveals several bullish signals that could impact this trend:
Bullish trend reversal : Moving Average 20
Type : Bullish
Timeframe : Daily
Bullish trend reversal : adaptative moving average 20
Type : Bullish
Timeframe : Daily
Bullish trend reversal : adaptative moving average 50
Type : Bullish
Timeframe : Daily
Technical indicators are strongly bullish, suggesting that the price increase should continue.
But beware of excesses. The Central Indicators scanner currently detects this:
CCI indicator is overbought : over 100
Type : Neutral
Timeframe : Daily
Williams %R indicator is overbought : over -20
Type : Neutral
Timeframe : Daily
Pivot points : price is over resistance 1
Type : Neutral
Timeframe : Weekly
MACD indicator is back over 0
Type : Bullish
Timeframe : Daily
The analysis of the price chart with Central Patterns scanners does not return any result.
The Central Candlesticks scanner, specialised in Japanese candlesticks, did not identify any signals.
| S3 | S2 | S1 | Price | R1 | R2 | |
|---|---|---|---|---|---|---|
| ProTrendLines | 0.015070 | 0.016660 | 0.019425 | 0.020106 | 0.024542 | 0.044310 |
| Change (%) | -25.05% | -17.14% | -3.39% | - | +22.06% | +120.38% |
| Change | -0.005036 | -0.003446 | -0.000681 | - | +0.004436 | +0.024204 |
| Level | Minor | Major | Intermediate | - | Major | Minor |
To determine price objectives, it is also possible to use the pivot points. Here is the price position in relation to pivot points:
| Pivot points | S3 | S2 | S1 | PP | R1 | R2 | R3 |
|---|---|---|---|---|---|---|---|
| Standard | 0.015109 | 0.016292 | 0.018211 | 0.019394 | 0.021313 | 0.022496 | 0.024415 |
| Camarilla | 0.019278 | 0.019562 | 0.019847 | 0.020131 | 0.020415 | 0.020700 | 0.020984 |
| Woodie | 0.015478 | 0.016476 | 0.018580 | 0.019578 | 0.021682 | 0.022680 | 0.024784 |
| Fibonacci | 0.016292 | 0.017477 | 0.018209 | 0.019394 | 0.020579 | 0.021311 | 0.022496 |
| Pivot points | S3 | S2 | S1 | PP | R1 | R2 | R3 |
|---|---|---|---|---|---|---|---|
| Standard | 0.013950 | 0.015771 | 0.016855 | 0.018676 | 0.019760 | 0.021581 | 0.022665 |
| Camarilla | 0.017139 | 0.017405 | 0.017672 | 0.017938 | 0.018204 | 0.018471 | 0.018737 |
| Woodie | 0.013581 | 0.015587 | 0.016486 | 0.018492 | 0.019391 | 0.021397 | 0.022296 |
| Fibonacci | 0.015771 | 0.016881 | 0.017567 | 0.018676 | 0.019786 | 0.020472 | 0.021581 |
| Pivot points | S3 | S2 | S1 | PP | R1 | R2 | R3 |
|---|---|---|---|---|---|---|---|
| Standard | 0.003569 | 0.009871 | 0.013380 | 0.019682 | 0.023191 | 0.029493 | 0.033002 |
| Camarilla | 0.014192 | 0.015091 | 0.015991 | 0.016890 | 0.017789 | 0.018689 | 0.019588 |
| Woodie | 0.002174 | 0.009173 | 0.011985 | 0.018984 | 0.021796 | 0.028795 | 0.031607 |
| Fibonacci | 0.009871 | 0.013619 | 0.015934 | 0.019682 | 0.023430 | 0.025745 | 0.029493 |
Numerical data
The following are the details of the technical indicators and moving averages that were collected to generate this technical analysis:
| RSI (14): | 56.76 | |
| MACD (12,26,9): | 0.0000 | |
| Directional Movement: | 6.600277 | |
| AROON (14): | 100.000000 | |
| DEMA (21): | 0.018615 | |
| Parabolic SAR (0,02-0,02-0,2): | 0.017269 | |
| Elder Ray (13): | 0.001442 | |
| Super Trend (3,10): | 0.021649 | |
| Zig ZAG (10): | 0.020039 | |
| VORTEX (21): | 1.0485 | |
| Stochastique (14,3,5): | 73.76 | |
| TEMA (21): | 0.018816 | |
| Williams %R (14): | -15.11 | |
| Chande Momentum Oscillator (20): | 0.001160 | |
| Repulse (5,40,3): | 6.1448 | |
| ROCnROLL: | 1 | |
| TRIX (15,9): | -0.1822 | |
| Courbe Coppock: | 10.89 |
| MA7: | 0.018578 | |
| MA20: | 0.018333 | |
| MA50: | 0.019241 | |
| MA100: | 0.017636 | |
| MAexp7: | 0.018971 | |
| MAexp20: | 0.018708 | |
| MAexp50: | 0.018596 | |
| MAexp100: | 0.016782 | |
| Price / MA7: | +8.22% | |
| Price / MA20: | +9.67% | |
| Price / MA50: | +4.50% | |
| Price / MA100: | +14.01% | |
| Price / MAexp7: | +5.98% | |
| Price / MAexp20: | +7.47% | |
| Price / MAexp50: | +8.12% | |
| Price / MAexp100: | +19.81% |
About author

Online


Add a comment
Comments
0 comments on the analysis JASMYCOIN - JASMY/USD - Daily