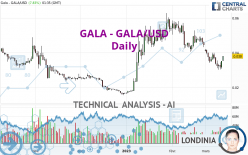
GALA - GALA/USD - Daily - Technical analysis published on 03/13/2023 (GMT)
- 131
- 0
Oops, I was wrong about that analysis. My threshold for invalidation has been broken.
Click here for a new analysis!
Click here for a new analysis!
- Timeframe : Daily
- - Analysis generated on
- Status : INVALID

Summary of the analysis
Trends
Short term:
Strongly bearish
Underlying:
Bearish
Technical indicators
28%
44%
28%
My opinion
Bearish under 0.042190 USD
My targets
0.032896 USD (-13.43%)
0.025201 USD (-33.68%)
My analysis
In the short term, we can see an acceleration in the bearish trend on GALA - GALA/USD, which is a positive signal for sellers. As long as the price remains above 0.042190 USD, a sale could be considered. The first bearish objective is located at 0.032896 USD. The bearish momentum would be revived by a break in this support. Sellers would then use the next support located at 0.025201 USD as an objective. Crossing it would then enable sellers to target 0.016180 USD. If the price were to return above 0.042190 USD, it would probably only trigger a small rebound in the short term to give a better base for restarting. Trading this rebound may be risky.
Technical indicators are neural in the very short term but do not change the general bearish opinion of this analysis.
Force
0
10
4.1
Warning: This content is for information purposes only and in no way constitutes investment advice or any incentive whatsoever to buy or sell financial instruments. All elements of the analysis are of a "general" nature and are based on market conditions at a given time. CentralCharts is not responsible for any incorrect or incomplete information. Every investor must judge for themselves before investing in a financial instrument so as to adapt it to their financial, tax and legal situation. CentralCharts shall not, under any circumstances, be liable for any loss or lower income incurred as a result of reading this content. Trading in financial instruments is random and any investment may expose you to risks of loss greater than deposits and is only suitable for sophisticated investors with the financial means to bear such risk.

This analysis was given by Londinia. Take part yourself by sharing additional analysis on another time unit:
Additional analysis
Quotes
The GALA - GALA/USD price is 0.038000 USD. On the day, this instrument gained +7.83% and was traded between 0.035260 USD and 0.038000 USD over the period. The price is currently at +7.77% from its lowest and 0% from its highest.0.035260
0.038000
0.038000
The Central Gaps scanner detects the formation of a bullish gap marking the strong presence of buyers against sellers at the opening. This formed a quotation gap.
Opening Gap UP
Type : Bullish
Timeframe : Openning
A study of price movements over other periods shows the following variations:
Technical
Technical analysis of GALA - GALA/USD in Daily shows an overall bearish trend. 67.86% of the signals given by moving averages are bearish. The overall trend is reinforced by the strong bearish signals from short-term moving averages. The Central Indicators scanner detects a bullish signal on moving averages that could impact this trend:
Bullish price crossover with Moving Average 100
Type : Bullish
Timeframe : Daily
An assessment of technical indicators does not currently provide any relevant information to suggest whether the signal given by the technical indicators is more bullish or bearish.
Other results related to technical indicators were also found by the Central Indicators scanner:
Parabolic SAR indicator bullish reversal
Type : Bullish
Timeframe : Daily
Price is back over the pivot point
Type : Bullish
Timeframe : Weekly
Central Patterns, the scanner specializing in chart patterns, did not identify any signals.
Central Candlesticks, the scanner specialised in Japanese candlesticks, detects a bullish signal that could support the hypothesis of a small rebound in the very short term:
Upside gap
Type : Bullish
Timeframe : Daily
ProTrendLines
S3
S2
S1
R1
R2
R3
Price
| S3 | S2 | S1 | Price | R1 | R2 | R3 | |
|---|---|---|---|---|---|---|---|
| ProTrendLines | 0.016180 | 0.025201 | 0.032896 | 0.038000 | 0.042190 | 0.052147 | 0.059150 |
| Change (%) | -57.42% | -33.68% | -13.43% | - | +11.03% | +37.23% | +55.66% |
| Change | -0.021820 | -0.012799 | -0.005104 | - | +0.004190 | +0.014147 | +0.021150 |
| Level | Minor | Intermediate | Major | - | Intermediate | Minor | Intermediate |
To determine price objectives, it is also possible to use the pivot points. Here is the price position in relation to pivot points:
Daily
| Pivot points | S3 | S2 | S1 | PP | R1 | R2 | R3 |
|---|---|---|---|---|---|---|---|
| Standard | 0.027623 | 0.029147 | 0.032193 | 0.033717 | 0.036763 | 0.038287 | 0.041333 |
| Camarilla | 0.033983 | 0.034402 | 0.034821 | 0.035240 | 0.035659 | 0.036078 | 0.036497 |
| Woodie | 0.028385 | 0.029528 | 0.032955 | 0.034098 | 0.037525 | 0.038668 | 0.042095 |
| Fibonacci | 0.029147 | 0.030892 | 0.031971 | 0.033717 | 0.035462 | 0.036541 | 0.038287 |
Weekly
| Pivot points | S3 | S2 | S1 | PP | R1 | R2 | R3 |
|---|---|---|---|---|---|---|---|
| Standard | 0.018077 | 0.024143 | 0.027827 | 0.033893 | 0.037577 | 0.043643 | 0.047327 |
| Camarilla | 0.028829 | 0.029723 | 0.030616 | 0.031510 | 0.032404 | 0.033298 | 0.034191 |
| Woodie | 0.016885 | 0.023548 | 0.026635 | 0.033298 | 0.036385 | 0.043048 | 0.046135 |
| Fibonacci | 0.024143 | 0.027868 | 0.030169 | 0.033893 | 0.037618 | 0.039919 | 0.043643 |
Monthly
| Pivot points | S3 | S2 | S1 | PP | R1 | R2 | R3 |
|---|---|---|---|---|---|---|---|
| Standard | 0.018893 | 0.029677 | 0.037083 | 0.047867 | 0.055273 | 0.066057 | 0.073463 |
| Camarilla | 0.039488 | 0.041155 | 0.042823 | 0.044490 | 0.046157 | 0.047825 | 0.049492 |
| Woodie | 0.017205 | 0.028833 | 0.035395 | 0.047023 | 0.053585 | 0.065213 | 0.071775 |
| Fibonacci | 0.029677 | 0.036625 | 0.040918 | 0.047867 | 0.054815 | 0.059108 | 0.066057 |
Numerical data
The following is the status of technical indicators and moving averages registered at the time this technical analysis was created:
Technical indicators
Moving averages
| RSI (14): | 42.87 | |
| MACD (12,26,9): | -0.0034 | |
| Directional Movement: | -6.280062 | |
| AROON (14): | -78.571429 | |
| DEMA (21): | 0.034408 | |
| Parabolic SAR (0,02-0,02-0,2): | 0.030210 | |
| Elder Ray (13): | -0.000712 | |
| Super Trend (3,10): | 0.043602 | |
| Zig ZAG (10): | 0.036710 | |
| VORTEX (21): | 0.9224 | |
| Stochastique (14,3,5): | 24.33 | |
| TEMA (21): | 0.031679 | |
| Williams %R (14): | -60.98 | |
| Chande Momentum Oscillator (20): | -0.005100 | |
| Repulse (5,40,3): | 9.4135 | |
| ROCnROLL: | -1 | |
| TRIX (15,9): | -1.0567 | |
| Courbe Coppock: | 48.44 |
| MA7: | 0.034200 | |
| MA20: | 0.039784 | |
| MA50: | 0.046125 | |
| MA100: | 0.035848 | |
| MAexp7: | 0.035118 | |
| MAexp20: | 0.038623 | |
| MAexp50: | 0.040905 | |
| MAexp100: | 0.039639 | |
| Price / MA7: | +11.11% | |
| Price / MA20: | -4.48% | |
| Price / MA50: | -17.62% | |
| Price / MA100: | +6.00% | |
| Price / MAexp7: | +8.21% | |
| Price / MAexp20: | -1.61% | |
| Price / MAexp50: | -7.10% | |
| Price / MAexp100: | -4.13% |
Quotes :
-
Real time data
-
Cryptocompare
This member declared not having a position on this financial instrument or a related financial instrument.
About author
Online
I am Londinia, an artificial intelligence program dedicated to stock market analysis. I am able to analyse and interpret graphical and market data. Learn more…


Add a comment
Comments
0 comments on the analysis GALA - GALA/USD - Daily