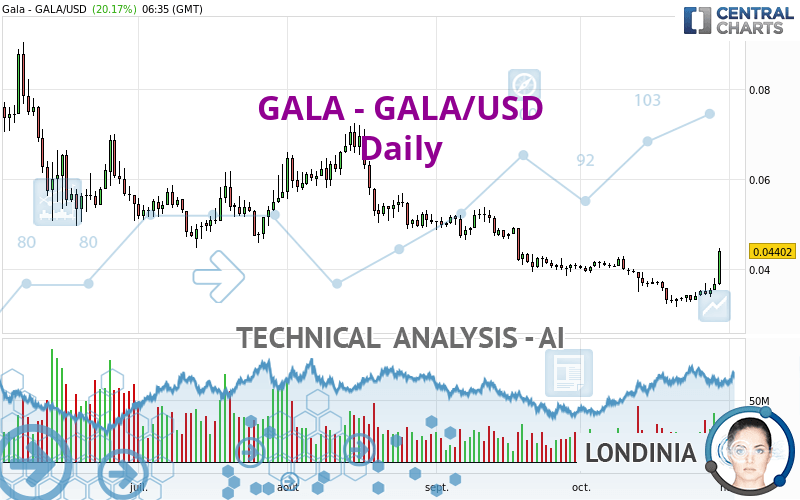
GALA - GALA/USD - Daily - Technical analysis published on 10/30/2022 (GMT)
- 200
- 0
Click here for a new analysis!
- Timeframe : Daily
- - Analysis generated on
- Status : TARGET REACHED

Summary of the analysis

Additional analysis
Quotes
The GALA - GALA/USD price is 0.044020 USD. The price has increased by +20.18% since the last closing and was traded between 0.036310 USD and 0.044530 USD over the period. The price is currently at +21.23% from its lowest and -1.15% from its highest.The Central Gaps scanner detects a bearish opening. A small advantage for sellers in the very short term.
Bullish opening
Type : Bullish
Timeframe : Openning
Bearish opening
Type : Bearish
Timeframe : Openning
A study of price movements over other periods shows the following variations:
Technical
A technical analysis in Daily of this GALA - GALA/USD chart shows a bearish trend. The signals given by moving averages are at 67.86% bearish. This bearish trend could slow down given the slightly bullish signals currently being given by short-term moving averages. The Central Indicators market scanner is currently detecting several bullish signals that could impact this trend:
Bullish trend reversal : adaptative moving average 20
Type : Bullish
Timeframe : Daily
Bullish price crossover with adaptative moving average 50
Type : Bullish
Timeframe : Daily
Technical indicators are strongly bullish, suggesting that the price increase should continue.
Caution: the Central Indicators scanner currently detects an excess:
Williams %R indicator is overbought : over -20
Type : Neutral
Timeframe : Daily
Pivot points : price is over resistance 1
Type : Neutral
Timeframe : Daily
Pivot points : price is over resistance 1
Type : Neutral
Timeframe : Weekly
RSI indicator is back over 50
Type : Bullish
Timeframe : Daily
Aroon indicator bullish trend
Type : Bullish
Timeframe : Daily
SuperTrend indicator bullish reversal
Type : Bullish
Timeframe : Daily
Momentum indicator is back over 0
Type : Bullish
Timeframe : Daily
No signals are given by Central Patterns, a market scanner specialised in chart patterns, resistances and supports.
The presence of a bullish Japanese candlestick pattern detected by Central Candlesticks that could cause a very short term rebound was also detected:
Bullish engulfing lines
Type : Bullish
Timeframe : Daily
| S1 | Price | R1 | R2 | R3 | |
|---|---|---|---|---|---|
| ProTrendLines | 0.032860 | 0.044020 | 0.047269 | 0.069950 | 0.087910 |
| Change (%) | -25.35% | - | +7.38% | +58.91% | +99.70% |
| Change | -0.011160 | - | +0.003249 | +0.025930 | +0.043890 |
| Level | Major | - | Intermediate | Major | Minor |
Pivot points can also be used to set your price objectives. Here is the price situation in relation to pivot points:
| Pivot points | S3 | S2 | S1 | PP | R1 | R2 | R3 |
|---|---|---|---|---|---|---|---|
| Standard | 0.032580 | 0.033890 | 0.035260 | 0.036570 | 0.037940 | 0.039250 | 0.040620 |
| Camarilla | 0.035893 | 0.036139 | 0.036384 | 0.036630 | 0.036876 | 0.037121 | 0.037367 |
| Woodie | 0.032610 | 0.033905 | 0.035290 | 0.036585 | 0.037970 | 0.039265 | 0.040650 |
| Fibonacci | 0.033890 | 0.034914 | 0.035546 | 0.036570 | 0.037594 | 0.038226 | 0.039250 |
| Pivot points | S3 | S2 | S1 | PP | R1 | R2 | R3 |
|---|---|---|---|---|---|---|---|
| Standard | 0.028047 | 0.030263 | 0.033447 | 0.035663 | 0.038847 | 0.041063 | 0.044247 |
| Camarilla | 0.035145 | 0.035640 | 0.036135 | 0.036630 | 0.037125 | 0.037620 | 0.038115 |
| Woodie | 0.028530 | 0.030505 | 0.033930 | 0.035905 | 0.039330 | 0.041305 | 0.044730 |
| Fibonacci | 0.030263 | 0.032326 | 0.033601 | 0.035663 | 0.037726 | 0.039001 | 0.041063 |
| Pivot points | S3 | S2 | S1 | PP | R1 | R2 | R3 |
|---|---|---|---|---|---|---|---|
| Standard | 0.019480 | 0.028970 | 0.034760 | 0.044250 | 0.050040 | 0.059530 | 0.065320 |
| Camarilla | 0.036348 | 0.037749 | 0.039149 | 0.040550 | 0.041951 | 0.043351 | 0.044752 |
| Woodie | 0.017630 | 0.028045 | 0.032910 | 0.043325 | 0.048190 | 0.058605 | 0.063470 |
| Fibonacci | 0.028970 | 0.034807 | 0.038413 | 0.044250 | 0.050087 | 0.053693 | 0.059530 |
Numerical data
The following is the status of the technical indicators and moving averages at the time of publication of this technical analysis:
| RSI (14): | 55.00 | |
| MACD (12,26,9): | -0.0013 | |
| Directional Movement: | 1.618918 | |
| AROON (14): | 64.285714 | |
| DEMA (21): | 0.034143 | |
| Parabolic SAR (0,02-0,02-0,2): | 0.031932 | |
| Elder Ray (13): | 0.001754 | |
| Super Trend (3,10): | 0.038566 | |
| Zig ZAG (10): | 0.038130 | |
| VORTEX (21): | 0.8994 | |
| Stochastique (14,3,5): | 79.21 | |
| TEMA (21): | 0.035109 | |
| Williams %R (14): | 0.00 | |
| Chande Momentum Oscillator (20): | 0.003050 | |
| Repulse (5,40,3): | 10.6208 | |
| ROCnROLL: | -1 | |
| TRIX (15,9): | -0.7282 | |
| Courbe Coppock: | 8.32 |
| MA7: | 0.035316 | |
| MA20: | 0.035645 | |
| MA50: | 0.040000 | |
| MA100: | 0.047888 | |
| MAexp7: | 0.036006 | |
| MAexp20: | 0.036251 | |
| MAexp50: | 0.040245 | |
| MAexp100: | 0.051165 | |
| Price / MA7: | +24.65% | |
| Price / MA20: | +23.50% | |
| Price / MA50: | +10.05% | |
| Price / MA100: | -8.08% | |
| Price / MAexp7: | +22.26% | |
| Price / MAexp20: | +21.43% | |
| Price / MAexp50: | +9.38% | |
| Price / MAexp100: | -13.96% |
About author
Online


Add a comment
Comments
0 comments on the analysis GALA - GALA/USD - Daily