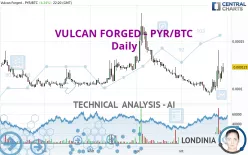
VULCAN FORGED (PYR) - PYR/BTC - Daily - Technical analysis published on 10/29/2023 (GMT)
- 120
- 0
Click here for a new analysis!
- Timeframe : Daily
- - Analysis generated on
- Status : INVALID

Summary of the analysis

Additional analysis
Quotes
The VULCAN FORGED - PYR/BTC rating is 0.000123 BTC. On the day, this instrument gained +4.24% and was between 0.000116 BTC and 0.000127 BTC. This implies that the price is at +6.03% from its lowest and at -3.15% from its highest.A study of price movements over other periods shows the following variations:
Near a new LOW record (5 years)
Type : Bearish
Timeframe : Weekly
The Central Volumes scanner detects abnormal volumes on the asset:
Abnormal volumes
Timeframe : 5 days
Technical
A technical analysis in Daily of this VULCAN FORGED - PYR/BTC chart shows a bullish trend. 64.29% of the signals given by moving averages are bullish. The overall trend is reinforced by the strong bullish signals from short-term moving averages. The Central Indicators scanner detects bearish signals on moving averages that could impact this trend:
Bearish price crossover with Moving Average 50
Type : Bearish
Timeframe : Daily
Bearish price crossover with Moving Average 100
Type : Bearish
Timeframe : Daily
Bearish price crossover with adaptative moving average 50
Type : Bearish
Timeframe : Daily
An assessment of technical indicators shows a strong bullish signal.
But beware of excesses. The Central Indicators scanner currently detects this:
CCI indicator is overbought : over 100
Type : Neutral
Timeframe : Daily
Pivot points : price is over resistance 2
Type : Neutral
Timeframe : Weekly
No signals are given by Central Patterns, a market scanner specialised in chart patterns, resistances and supports.
No result was found by the Central Candlesticks scanner on Japanese candlesticks.
| S3 | S2 | S1 | Price | R1 | R2 | R3 | |
|---|---|---|---|---|---|---|---|
| ProTrendLines | 0.000096 | 0.000104 | 0.000117 | 0.000123 | 0.000126 | 0.000140 | 0.000166 |
| Change (%) | -21.95% | -15.45% | -4.88% | - | +2.44% | +13.82% | +34.96% |
| Change | -0.000027 | -0.000019 | -0.000006 | - | +0.000003 | +0.000017 | +0.000043 |
| Level | Major | Intermediate | Intermediate | - | Minor | Major | Intermediate |
To determine price objectives, it is also possible to use the pivot points. Here is the price position in relation to pivot points:
| Pivot points | S3 | S2 | S1 | PP | R1 | R2 | R3 |
|---|---|---|---|---|---|---|---|
| Standard | 0.000097 | 0.000103 | 0.000111 | 0.000117 | 0.000125 | 0.000131 | 0.000139 |
| Camarilla | 0.000114 | 0.000115 | 0.000117 | 0.000118 | 0.000119 | 0.000121 | 0.000122 |
| Woodie | 0.000097 | 0.000104 | 0.000111 | 0.000118 | 0.000125 | 0.000132 | 0.000139 |
| Fibonacci | 0.000103 | 0.000109 | 0.000112 | 0.000117 | 0.000123 | 0.000126 | 0.000131 |
| Pivot points | S3 | S2 | S1 | PP | R1 | R2 | R3 |
|---|---|---|---|---|---|---|---|
| Standard | 0.000052 | 0.000075 | 0.000096 | 0.000119 | 0.000140 | 0.000163 | 0.000184 |
| Camarilla | 0.000106 | 0.000110 | 0.000114 | 0.000118 | 0.000122 | 0.000126 | 0.000130 |
| Woodie | 0.000052 | 0.000075 | 0.000096 | 0.000119 | 0.000140 | 0.000163 | 0.000184 |
| Fibonacci | 0.000075 | 0.000092 | 0.000102 | 0.000119 | 0.000136 | 0.000146 | 0.000163 |
| Pivot points | S3 | S2 | S1 | PP | R1 | R2 | R3 |
|---|---|---|---|---|---|---|---|
| Standard | 0.000073 | 0.000092 | 0.000103 | 0.000122 | 0.000133 | 0.000152 | 0.000163 |
| Camarilla | 0.000106 | 0.000109 | 0.000111 | 0.000114 | 0.000117 | 0.000120 | 0.000122 |
| Woodie | 0.000069 | 0.000090 | 0.000099 | 0.000120 | 0.000129 | 0.000150 | 0.000159 |
| Fibonacci | 0.000092 | 0.000104 | 0.000111 | 0.000122 | 0.000134 | 0.000141 | 0.000152 |
Numerical data
The following is the status of technical indicators and moving averages registered at the time this technical analysis was created:
| RSI (14): | 64.01 | |
| MACD (12,26,9): | 0.0000 | |
| Directional Movement: | 28.847872 | |
| AROON (14): | 42.857143 | |
| DEMA (21): | 0.000110 | |
| Parabolic SAR (0,02-0,02-0,2): | 0.000107 | |
| Elder Ray (13): | 0.000011 | |
| Super Trend (3,10): | 0.000096 | |
| Zig ZAG (10): | 0.000123 | |
| VORTEX (21): | 1.0710 | |
| Stochastique (14,3,5): | 50.69 | |
| TEMA (21): | 0.000114 | |
| Williams %R (14): | -37.50 | |
| Chande Momentum Oscillator (20): | 0.000024 | |
| Repulse (5,40,3): | 5.7461 | |
| ROCnROLL: | 1 | |
| TRIX (15,9): | -0.2403 | |
| Courbe Coppock: | 19.66 |
| MA7: | 0.000113 | |
| MA20: | 0.000106 | |
| MA50: | 0.000113 | |
| MA100: | 0.000116 | |
| MAexp7: | 0.000114 | |
| MAexp20: | 0.000109 | |
| MAexp50: | 0.000112 | |
| MAexp100: | 0.000115 | |
| Price / MA7: | +8.85% | |
| Price / MA20: | +16.04% | |
| Price / MA50: | +8.85% | |
| Price / MA100: | +6.03% | |
| Price / MAexp7: | +7.89% | |
| Price / MAexp20: | +12.84% | |
| Price / MAexp50: | +9.82% | |
| Price / MAexp100: | +6.96% |
About author

Online


Add a comment
Comments
0 comments on the analysis VULCAN FORGED (PYR) - PYR/BTC - Daily