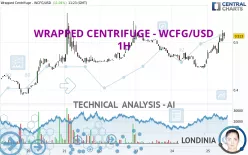
WRAPPED CENTRIFUGE - WCFG/USD - 1H - Technical analysis published on 06/25/2024 (GMT)
- 162
- 0
Click here for a new analysis!
- Timeframe : 1H
- - Analysis generated on
- Status : TARGET REACHED

Summary of the analysis
Additional analysis
Quotes
The WRAPPED CENTRIFUGE - WCFG/USD price is 0.513000 USD. The price registered an increase of +11.04% on the session and was traded between 0.465000 USD and 0.525000 USD over the period. The price is currently at +10.32% from its lowest and -2.29% from its highest.The Central Gaps scanner detects a bullish opening marking the presence of buyers ahead of sellers at the opening but not sufficiently marked to allow the price to register a quotation gap.
Bullish opening
Type : Bullish
Timeframe : Openning
A study of price movements over other periods shows the following variations:
Technical
Technical analysis of this 1H chart of WRAPPED CENTRIFUGE - WCFG/USD indicates that the overall trend is strongly bullish. 85.71% of the signals given by moving averages are bullish. This strongly bullish trend is supported by the strong bullish signals given by short-term moving averages. An assessment of moving averages reveals a bullish signal that could impact this trend:
Moving Average bullish crossovers : MA50 & MA100
Type : Bullish
Timeframe : 1 hour
The probability of a further increase is high given the direction of the technical indicators.
Caution: the Central Indicators scanner currently detects an excess:
CCI indicator is overbought : over 100
Type : Neutral
Timeframe : 1 hour
CCI indicator: bearish divergence
Type : Bearish
Timeframe : 1 hour
Williams %R indicator is overbought : over -20
Type : Neutral
Timeframe : 1 hour
Pivot points : price is over resistance 3
Type : Neutral
Timeframe : 1 hour
No signals are given by Central Patterns, a market scanner specialised in chart patterns, resistances and supports.
No result was found by the Central Candlesticks scanner on Japanese candlesticks.
| S3 | S2 | S1 | Price | R1 | R2 | R3 | |
|---|---|---|---|---|---|---|---|
| ProTrendLines | 0.461182 | 0.478000 | 0.494000 | 0.513000 | 0.524000 | 0.561000 | 0.633000 |
| Change (%) | -10.10% | -6.82% | -3.70% | - | +2.14% | +9.36% | +23.39% |
| Change | -0.051818 | -0.035000 | -0.019000 | - | +0.011000 | +0.048000 | +0.120000 |
| Level | Intermediate | Major | Major | - | Minor | Major | Intermediate |
Pivot points can also be used to set your price objectives. Here is the price situation in relation to pivot points:
| Pivot points | S3 | S2 | S1 | PP | R1 | R2 | R3 |
|---|---|---|---|---|---|---|---|
| Standard | 0.412333 | 0.428667 | 0.445333 | 0.461667 | 0.478333 | 0.494667 | 0.511333 |
| Camarilla | 0.452925 | 0.455950 | 0.458975 | 0.462000 | 0.465025 | 0.468050 | 0.471075 |
| Woodie | 0.412500 | 0.428750 | 0.445500 | 0.461750 | 0.478500 | 0.494750 | 0.511500 |
| Fibonacci | 0.428667 | 0.441273 | 0.449061 | 0.461667 | 0.474273 | 0.482061 | 0.494667 |
| Pivot points | S3 | S2 | S1 | PP | R1 | R2 | R3 |
|---|---|---|---|---|---|---|---|
| Standard | 0.238333 | 0.313667 | 0.410333 | 0.485667 | 0.582333 | 0.657667 | 0.754333 |
| Camarilla | 0.459700 | 0.475467 | 0.491233 | 0.507000 | 0.522767 | 0.538533 | 0.554300 |
| Woodie | 0.249000 | 0.319000 | 0.421000 | 0.491000 | 0.593000 | 0.663000 | 0.765000 |
| Fibonacci | 0.313667 | 0.379371 | 0.419963 | 0.485667 | 0.551371 | 0.591963 | 0.657667 |
| Pivot points | S3 | S2 | S1 | PP | R1 | R2 | R3 |
|---|---|---|---|---|---|---|---|
| Standard | 0.402000 | 0.500000 | 0.586000 | 0.684000 | 0.770000 | 0.868000 | 0.954000 |
| Camarilla | 0.621400 | 0.638267 | 0.655133 | 0.672000 | 0.688867 | 0.705733 | 0.722600 |
| Woodie | 0.396000 | 0.497000 | 0.580000 | 0.681000 | 0.764000 | 0.865000 | 0.948000 |
| Fibonacci | 0.500000 | 0.570288 | 0.613712 | 0.684000 | 0.754288 | 0.797712 | 0.868000 |
Numerical data
The following is the status of the technical indicators and moving averages at the time of publication of this technical analysis:
| RSI (14): | 65.65 | |
| MACD (12,26,9): | 0.0111 | |
| Directional Movement: | 32.056908 | |
| AROON (14): | 92.857143 | |
| DEMA (21): | 0.497635 | |
| Parabolic SAR (0,02-0,02-0,2): | 0.483230 | |
| Elder Ray (13): | 0.022144 | |
| Super Trend (3,10): | 0.480997 | |
| Zig ZAG (10): | 0.510000 | |
| VORTEX (21): | 1.1810 | |
| Stochastique (14,3,5): | 85.43 | |
| TEMA (21): | 0.508582 | |
| Williams %R (14): | -16.46 | |
| Chande Momentum Oscillator (20): | 0.050000 | |
| Repulse (5,40,3): | 1.8334 | |
| ROCnROLL: | 1 | |
| TRIX (15,9): | 0.1629 | |
| Courbe Coppock: | 21.40 |
| MA7: | 0.467143 | |
| MA20: | 0.527750 | |
| MA50: | 0.627180 | |
| MA100: | 0.719100 | |
| MAexp7: | 0.503002 | |
| MAexp20: | 0.487235 | |
| MAexp50: | 0.479600 | |
| MAexp100: | 0.476520 | |
| Price / MA7: | +9.82% | |
| Price / MA20: | -2.79% | |
| Price / MA50: | -18.21% | |
| Price / MA100: | -28.66% | |
| Price / MAexp7: | +1.99% | |
| Price / MAexp20: | +5.29% | |
| Price / MAexp50: | +6.96% | |
| Price / MAexp100: | +7.66% |
About author

Online


Add a comment
Comments
0 comments on the analysis WRAPPED CENTRIFUGE - WCFG/USD - 1H