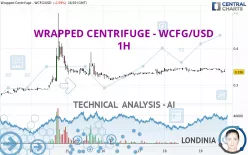
WRAPPED CENTRIFUGE - WCFG/USD - 1H - Technical analysis published on 03/19/2023 (GMT)
- 235
- 0
- Timeframe : 1H
- - Analysis generated on
- Status : NEUTRAL

Summary of the analysis
Additional analysis
Quotes
The WRAPPED CENTRIFUGE - WCFG/USD rating is 0.336000 USD. The price registered a decrease of -0.59% on the session and was traded between 0.332000 USD and 0.347000 USD over the period. The price is currently at +1.20% from its lowest and -3.17% from its highest.The Central Gaps scanner detects a bullish opening. A small advantage for buyers in the very short term.
Bullish opening
Type : Bullish
Timeframe : Openning
So that you have an overall view of the price change, here is a table showing the variations over several periods:
Technical
Technical analysis of this 1H chart of WRAPPED CENTRIFUGE - WCFG/USD indicates that the overall trend is not clearly defined. The slightly bearish signals currently given by short-term moving averages could allow the overall trend to return to a slightly bearish trend. An assessment of moving averages reveals a bearish signal that could impact this trend:
Bearish trend reversal : adaptative moving average 50
Type : Bearish
Timeframe : 1 hour
Technical indicators are strongly bearish, suggesting that the price decline is expected to continue.
Caution: the Central Indicators scanner currently detects an excess:
CCI indicator is oversold : under -100
Type : Neutral
Timeframe : 1 hour
Pivot points : price is over resistance 1
Type : Neutral
Timeframe : Weekly
MACD indicator is back under 0
Type : Bearish
Timeframe : 1 hour
No signals are given by Central Patterns, a market scanner specialised in chart patterns, resistances and supports.
Central Candlesticks, the scanner specialised in Japanese candlesticks, detects this inversion signal that could impact the current short-term trend:
Doji
Type : Neutral
Timeframe : 1 hour
| S3 | S2 | S1 | Price | R1 | R2 | R3 | |
|---|---|---|---|---|---|---|---|
| ProTrendLines | 0.255000 | 0.291000 | 0.316667 | 0.336000 | 0.337222 | 0.369000 | 0.390000 |
| Change (%) | -24.11% | -13.39% | -5.75% | - | +0.36% | +9.82% | +16.07% |
| Change | -0.081000 | -0.045000 | -0.019333 | - | +0.001222 | +0.033000 | +0.054000 |
| Level | Major | Intermediate | Major | - | Intermediate | Minor | Minor |
To determine price objectives, it is also possible to use the pivot points. Here is the price position in relation to pivot points:
| Pivot points | S3 | S2 | S1 | PP | R1 | R2 | R3 |
|---|---|---|---|---|---|---|---|
| Standard | 0.316333 | 0.324667 | 0.331333 | 0.339667 | 0.346333 | 0.354667 | 0.361333 |
| Camarilla | 0.333875 | 0.335250 | 0.336625 | 0.338000 | 0.339375 | 0.340750 | 0.342125 |
| Woodie | 0.315500 | 0.324250 | 0.330500 | 0.339250 | 0.345500 | 0.354250 | 0.360500 |
| Fibonacci | 0.324667 | 0.330397 | 0.333937 | 0.339667 | 0.345397 | 0.348937 | 0.354667 |
| Pivot points | S3 | S2 | S1 | PP | R1 | R2 | R3 |
|---|---|---|---|---|---|---|---|
| Standard | -0.029000 | 0.108000 | 0.223000 | 0.360000 | 0.475000 | 0.612000 | 0.727000 |
| Camarilla | 0.268700 | 0.291800 | 0.314900 | 0.338000 | 0.361100 | 0.384200 | 0.407300 |
| Woodie | -0.040000 | 0.102500 | 0.212000 | 0.354500 | 0.464000 | 0.606500 | 0.716000 |
| Fibonacci | 0.108000 | 0.204264 | 0.263736 | 0.360000 | 0.456264 | 0.515736 | 0.612000 |
| Pivot points | S3 | S2 | S1 | PP | R1 | R2 | R3 |
|---|---|---|---|---|---|---|---|
| Standard | 0.118667 | 0.180333 | 0.246667 | 0.308333 | 0.374667 | 0.436333 | 0.502667 |
| Camarilla | 0.277800 | 0.289533 | 0.301267 | 0.313000 | 0.324733 | 0.336467 | 0.348200 |
| Woodie | 0.121000 | 0.181500 | 0.249000 | 0.309500 | 0.377000 | 0.437500 | 0.505000 |
| Fibonacci | 0.180333 | 0.229229 | 0.259437 | 0.308333 | 0.357229 | 0.387437 | 0.436333 |
Numerical data
The following is the status of technical indicators and moving averages registered at the time this technical analysis was created:
| RSI (14): | 43.78 | |
| MACD (12,26,9): | 0.0000 | |
| Directional Movement: | -20.544936 | |
| AROON (14): | -92.857143 | |
| DEMA (21): | 0.342147 | |
| Parabolic SAR (0,02-0,02-0,2): | 0.346700 | |
| Elder Ray (13): | -0.005631 | |
| Super Trend (3,10): | 0.334639 | |
| Zig ZAG (10): | 0.338000 | |
| VORTEX (21): | 0.8488 | |
| Stochastique (14,3,5): | 36.51 | |
| TEMA (21): | 0.340780 | |
| Williams %R (14): | -57.14 | |
| Chande Momentum Oscillator (20): | -0.008000 | |
| Repulse (5,40,3): | 0.3636 | |
| ROCnROLL: | 2 | |
| TRIX (15,9): | 0.0305 | |
| Courbe Coppock: | 0.02 |
| MA7: | 0.330857 | |
| MA20: | 0.298900 | |
| MA50: | 0.286920 | |
| MA100: | 0.239970 | |
| MAexp7: | 0.340746 | |
| MAexp20: | 0.341784 | |
| MAexp50: | 0.339645 | |
| MAexp100: | 0.332501 | |
| Price / MA7: | +1.55% | |
| Price / MA20: | +12.41% | |
| Price / MA50: | +17.11% | |
| Price / MA100: | +40.02% | |
| Price / MAexp7: | -1.39% | |
| Price / MAexp20: | -1.69% | |
| Price / MAexp50: | -1.07% | |
| Price / MAexp100: | +1.05% |
About author

Online


Add a comment
Comments
0 comments on the analysis WRAPPED CENTRIFUGE - WCFG/USD - 1H