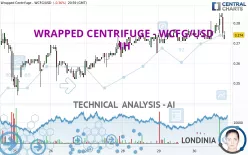
WRAPPED CENTRIFUGE - WCFG/USD - 1H - Technical analysis published on 01/30/2023 (GMT)
- 171
- 0
Click here for a new analysis!
- Timeframe : 1H
- - Analysis generated on
- Status : INVALID

Summary of the analysis
Additional analysis
Quotes
WRAPPED CENTRIFUGE - WCFG/USD rating 0.274000 USD. The price registered a decrease of -0.36% on the session and was between 0.272000 USD and 0.285000 USD. This implies that the price is at +0.74% from its lowest and at -3.86% from its highest.A study of price movements over other periods shows the following variations:
Technical
Technical analysis of this 1H chart of WRAPPED CENTRIFUGE - WCFG/USD indicates that the overall trend is bullish. The signals given by moving averages are 71.43% bullish. This bullish trend could slow down given the neutral signals currently being given by short-term moving averages. The Central Indicators scanner detects bearish signals on moving averages that could impact this trend:
Bearish price crossover with Moving Average 50
Type : Bearish
Timeframe : 1 hour
Bearish price crossover with adaptative moving average 20
Type : Bearish
Timeframe : 1 hour
An assessment of technical indicators does not currently provide any relevant information to suggest whether the signal given by the technical indicators is more bullish or bearish.
Caution: the Central Indicators scanner currently detects an excess:
Previous candle closed over Bollinger bands
Type : Neutral
Timeframe : 1 hour
Williams %R indicator is oversold : under -80
Type : Neutral
Timeframe : 1 hour
MACD crosses DOWN its Moving Average
Type : Bearish
Timeframe : 1 hour
SuperTrend indicator bearish reversal
Type : Bearish
Timeframe : 1 hour
Momentum indicator is back under 0
Type : Bearish
Timeframe : 1 hour
Central Patterns, the scanner specializing in chart patterns, did not identify any signals.
From the Japanese candlestick perspective, the Central Candlesticks scanner notes the presence of these results that could impact the short-term trend:
Bullish doji star
Type : Bullish
Timeframe : 1 hour
Doji
Type : Neutral
Timeframe : 1 hour
Long black line
Type : Bearish
Timeframe : 1 hour
| S3 | S2 | S1 | Price | R1 | R2 | R3 | |
|---|---|---|---|---|---|---|---|
| ProTrendLines | 0.244000 | 0.257000 | 0.268692 | 0.274000 | 0.291000 | 0.315750 | 0.338000 |
| Change (%) | -10.95% | -6.20% | -1.94% | - | +6.20% | +15.24% | +23.36% |
| Change | -0.030000 | -0.017000 | -0.005308 | - | +0.017000 | +0.041750 | +0.064000 |
| Level | Intermediate | Major | Major | - | Major | Intermediate | Intermediate |
Pivot points can also be used to set your price objectives. Here is the price situation in relation to pivot points:
| Pivot points | S3 | S2 | S1 | PP | R1 | R2 | R3 |
|---|---|---|---|---|---|---|---|
| Standard | 0.264000 | 0.267000 | 0.271000 | 0.274000 | 0.278000 | 0.281000 | 0.285000 |
| Camarilla | 0.273075 | 0.273717 | 0.274358 | 0.275000 | 0.275642 | 0.276283 | 0.276925 |
| Woodie | 0.264500 | 0.267250 | 0.271500 | 0.274250 | 0.278500 | 0.281250 | 0.285500 |
| Fibonacci | 0.267000 | 0.269674 | 0.271326 | 0.274000 | 0.276674 | 0.278326 | 0.281000 |
| Pivot points | S3 | S2 | S1 | PP | R1 | R2 | R3 |
|---|---|---|---|---|---|---|---|
| Standard | 0.138000 | 0.191000 | 0.232000 | 0.285000 | 0.326000 | 0.379000 | 0.420000 |
| Camarilla | 0.247150 | 0.255767 | 0.264383 | 0.273000 | 0.281617 | 0.290233 | 0.298850 |
| Woodie | 0.132000 | 0.188000 | 0.226000 | 0.282000 | 0.320000 | 0.376000 | 0.414000 |
| Fibonacci | 0.191000 | 0.226908 | 0.249092 | 0.285000 | 0.320908 | 0.343092 | 0.379000 |
| Pivot points | S3 | S2 | S1 | PP | R1 | R2 | R3 |
|---|---|---|---|---|---|---|---|
| Standard | 0.039333 | 0.094667 | 0.123333 | 0.178667 | 0.207333 | 0.262667 | 0.291333 |
| Camarilla | 0.128900 | 0.136600 | 0.144300 | 0.152000 | 0.159700 | 0.167400 | 0.175100 |
| Woodie | 0.026000 | 0.088000 | 0.110000 | 0.172000 | 0.194000 | 0.256000 | 0.278000 |
| Fibonacci | 0.094667 | 0.126755 | 0.146579 | 0.178667 | 0.210755 | 0.230579 | 0.262667 |
Numerical data
The following are the details of the technical indicators and moving averages that were collected to generate this technical analysis:
| RSI (14): | 48.88 | |
| MACD (12,26,9): | 0.0016 | |
| Directional Movement: | 7.209729 | |
| AROON (14): | 71.428572 | |
| DEMA (21): | 0.278206 | |
| Parabolic SAR (0,02-0,02-0,2): | 0.285000 | |
| Elder Ray (13): | 0.001819 | |
| Super Trend (3,10): | 0.274248 | |
| Zig ZAG (10): | 0.275000 | |
| VORTEX (21): | 0.9265 | |
| Stochastique (14,3,5): | 38.46 | |
| TEMA (21): | 0.277529 | |
| Williams %R (14): | -92.31 | |
| Chande Momentum Oscillator (20): | -0.001000 | |
| Repulse (5,40,3): | -1.4831 | |
| ROCnROLL: | 2 | |
| TRIX (15,9): | 0.0581 | |
| Courbe Coppock: | 2.84 |
| MA7: | 0.266000 | |
| MA20: | 0.250800 | |
| MA50: | 0.202860 | |
| MA100: | 0.216030 | |
| MAexp7: | 0.276955 | |
| MAexp20: | 0.276296 | |
| MAexp50: | 0.273895 | |
| MAexp100: | 0.270553 | |
| Price / MA7: | +3.01% | |
| Price / MA20: | +9.25% | |
| Price / MA50: | +35.07% | |
| Price / MA100: | +26.83% | |
| Price / MAexp7: | -1.07% | |
| Price / MAexp20: | -0.83% | |
| Price / MAexp50: | +0.04% | |
| Price / MAexp100: | +1.27% |
About author

Online


Add a comment
Comments
0 comments on the analysis WRAPPED CENTRIFUGE - WCFG/USD - 1H