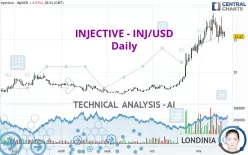
INJECTIVE - INJ/USD - Daily - Technical analysis published on 11/18/2023 (GMT)
- 274
- 0
Click here for a new analysis!
- Timeframe : Daily
- - Analysis generated on
- Status : TARGET REACHED

Summary of the analysis

Additional analysis
Quotes
The INJECTIVE - INJ/USD rating is 15.47 USD. On the day, this instrument lost -4.57% with the lowest point at 15.39 USD and the highest point at 16.21 USD. The deviation from the price is +0.52% for the low point and -4.57% for the high point.The Central Gaps scanner detects a bearish opening marking the presence of sellers ahead of buyers at the opening but not sufficiently marked to allow the price to register a quotation gap.
Bearish opening
Type : Bearish
Timeframe : Openning
Here is a more detailed summary of the historical variations registered by INJECTIVE - INJ/USD:
Near a new HIGH record (5 years)
Type : Bullish
Timeframe : Weekly
The Central Volumes scanner notes the presence of abnormal volumes:
Abnormal volumes
Timeframe : 5 days
Abnormal volumes
Timeframe : 20 days
Abnormal volumes
Timeframe : 50 days
Technical
A technical analysis in Daily of this INJECTIVE - INJ/USD chart shows a strongly bullish trend. 85.71% of the signals given by moving averages are bullish. The slightly bullish signals given by the short-term moving averages indicate this trend is showing signs of running out of steam. The Central Indicators scanner detects a bearish signal on moving averages that could impact this trend:
Bearish price crossover with Moving Average 20
Type : Bearish
Timeframe : Daily
In fact, according to the parameters integrated into the Central Analyzer system, only 8 technical indicators out of 18 analysed are currently bearish. Caution: the Central Indicators scanner currently detects an excess:
Williams %R indicator is oversold : under -80
Type : Neutral
Timeframe : Daily
Price is back under the pivot point
Type : Bearish
Timeframe : Daily
Price is back under the pivot point
Type : Bearish
Timeframe : Weekly
Momentum indicator is back under 0
Type : Bearish
Timeframe : Daily
The analysis of the price chart with Central Patterns scanners does not return any result.
The Central Candlesticks scanner which studies Japanese candlesticks did not detect anything.
| S3 | S2 | S1 | Price | R1 | R2 | |
|---|---|---|---|---|---|---|
| ProTrendLines | 7.93 | 9.46 | 13.21 | 15.47 | 16.49 | 18.04 |
| Change (%) | -48.74% | -38.85% | -14.61% | - | +6.59% | +16.61% |
| Change | -7.54 | -6.01 | -2.26 | - | +1.02 | +2.57 |
| Level | Major | Minor | Minor | - | Minor | Intermediate |
To determine price objectives, it is also possible to use the pivot points. Here is the price position in relation to pivot points:
| Pivot points | S3 | S2 | S1 | PP | R1 | R2 | R3 |
|---|---|---|---|---|---|---|---|
| Standard | 13.91 | 14.51 | 15.36 | 15.96 | 16.81 | 17.41 | 18.26 |
| Camarilla | 15.81 | 15.94 | 16.08 | 16.21 | 16.34 | 16.48 | 16.61 |
| Woodie | 14.04 | 14.57 | 15.49 | 16.02 | 16.94 | 17.47 | 18.39 |
| Fibonacci | 14.51 | 15.06 | 15.41 | 15.96 | 16.51 | 16.86 | 17.41 |
| Pivot points | S3 | S2 | S1 | PP | R1 | R2 | R3 |
|---|---|---|---|---|---|---|---|
| Standard | 10.89 | 12.82 | 15.26 | 17.19 | 19.63 | 21.56 | 24.00 |
| Camarilla | 16.50 | 16.90 | 17.30 | 17.70 | 18.10 | 18.50 | 18.90 |
| Woodie | 11.15 | 12.95 | 15.52 | 17.32 | 19.89 | 21.69 | 24.26 |
| Fibonacci | 12.82 | 14.49 | 15.52 | 17.19 | 18.86 | 19.89 | 21.56 |
| Pivot points | S3 | S2 | S1 | PP | R1 | R2 | R3 |
|---|---|---|---|---|---|---|---|
| Standard | 2.10 | 4.64 | 9.40 | 11.94 | 16.70 | 19.24 | 24.00 |
| Camarilla | 12.16 | 12.83 | 13.50 | 14.17 | 14.84 | 15.51 | 16.18 |
| Woodie | 3.22 | 5.20 | 10.52 | 12.50 | 17.82 | 19.80 | 25.12 |
| Fibonacci | 4.64 | 7.43 | 9.15 | 11.94 | 14.73 | 16.45 | 19.24 |
Numerical data
The following are the details of the technical indicators and moving averages that were collected to generate this technical analysis:
| RSI (14): | 55.29 | |
| MACD (12,26,9): | 1.2400 | |
| Directional Movement: | 6.16 | |
| AROON (14): | 50.00 | |
| DEMA (21): | 17.28 | |
| Parabolic SAR (0,02-0,02-0,2): | 18.77 | |
| Elder Ray (13): | -0.14 | |
| Super Trend (3,10): | 13.56 | |
| Zig ZAG (10): | 15.57 | |
| VORTEX (21): | 1.0700 | |
| Stochastique (14,3,5): | 32.54 | |
| TEMA (21): | 17.04 | |
| Williams %R (14): | -79.50 | |
| Chande Momentum Oscillator (20): | -1.43 | |
| Repulse (5,40,3): | -8.5900 | |
| ROCnROLL: | -1 | |
| TRIX (15,9): | 1.9200 | |
| Courbe Coppock: | 17.79 |
| MA7: | 16.13 | |
| MA20: | 15.95 | |
| MA50: | 11.75 | |
| MA100: | 9.47 | |
| MAexp7: | 16.12 | |
| MAexp20: | 15.42 | |
| MAexp50: | 12.85 | |
| MAexp100: | 10.76 | |
| Price / MA7: | -4.09% | |
| Price / MA20: | -3.01% | |
| Price / MA50: | +31.66% | |
| Price / MA100: | +63.36% | |
| Price / MAexp7: | -4.03% | |
| Price / MAexp20: | +0.32% | |
| Price / MAexp50: | +20.39% | |
| Price / MAexp100: | +43.77% |
About author

Online


Add a comment
Comments
0 comments on the analysis INJECTIVE - INJ/USD - Daily