INJECTIVE - INJ/USD - Daily - Technical analysis published on 11/29/2022 (GMT)
- 160
- 0
Click here for a new analysis!
- Timeframe : Daily
- - Analysis generated on
- Status : TARGET REACHED
Summary of the analysis

Additional analysis
Quotes
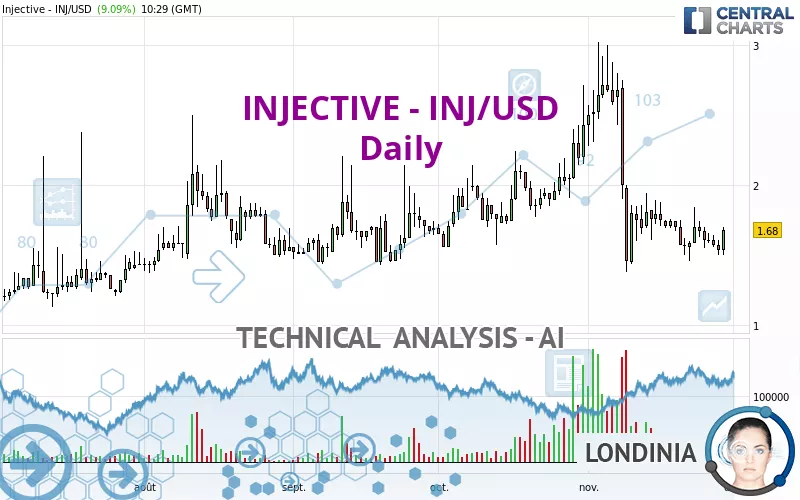
INJECTIVE - INJ/USD rating 1.68 USD. The price has increased by +9.09% since the last closing and was between 1.50 USD and 1.70 USD. This implies that the price is at +12.00% from its lowest and at -1.18% from its highest.So that you have an overall view of the price change, here is a table showing the variations over several periods:
Abnormal volumes
Timeframe : 50 days
Technical
Technical analysis of this Daily chart of INJECTIVE - INJ/USD indicates that the overall trend is bearish. The signals given by moving averages are 78.57% bearish. This bearish trend could slow down given the neutral signals currently being given by short-term moving averages. The Central Indicators scanner does not detect any result on moving averages that would impact this trend.
An assessment of technical indicators does not currently provide any relevant information to suggest whether the signal given by the technical indicators is more bullish or bearish.
Caution: the Central Indicators scanner currently detects an excess:
CCI indicator: bullish divergence
Type : Bullish
Timeframe : Daily
MACD indicator: bullish divergence
Type : Bullish
Timeframe : Daily
RSI indicator: bullish divergence
Type : Bullish
Timeframe : Daily
Pivot points : price is over resistance 2
Type : Neutral
Timeframe : Daily
MACD crosses UP its Moving Average
Type : Bullish
Timeframe : Daily
Price is back over the pivot point
Type : Bullish
Timeframe : Weekly
Williams %R indicator is back over -50
Type : Bullish
Timeframe : Daily
Central Patterns, the scanner specializing in chart patterns, did not identify any signals.
The Central Candlesticks scanner which studies Japanese candlesticks did not detect anything.
| S2 | S1 | Price | R1 | R2 | R3 | |
|---|---|---|---|---|---|---|
| ProTrendLines | 1.24 | 1.45 | 1.68 | 1.74 | 2.08 | 2.27 |
| Change (%) | -26.19% | -13.69% | - | +3.57% | +23.81% | +35.12% |
| Change | -0.44 | -0.23 | - | +0.06 | +0.40 | +0.59 |
| Level | Minor | Major | - | Minor | Intermediate | Minor |
Pivot points can also be used to set your price objectives. Here is the price situation in relation to pivot points:
| Pivot points | S3 | S2 | S1 | PP | R1 | R2 | R3 |
|---|---|---|---|---|---|---|---|
| Standard | 1.38 | 1.44 | 1.49 | 1.55 | 1.60 | 1.66 | 1.71 |
| Camarilla | 1.51 | 1.52 | 1.53 | 1.54 | 1.55 | 1.56 | 1.57 |
| Woodie | 1.38 | 1.44 | 1.49 | 1.55 | 1.60 | 1.66 | 1.71 |
| Fibonacci | 1.44 | 1.48 | 1.51 | 1.55 | 1.59 | 1.62 | 1.66 |
| Pivot points | S3 | S2 | S1 | PP | R1 | R2 | R3 |
|---|---|---|---|---|---|---|---|
| Standard | 1.05 | 1.26 | 1.43 | 1.64 | 1.81 | 2.02 | 2.19 |
| Camarilla | 1.51 | 1.54 | 1.58 | 1.61 | 1.65 | 1.68 | 1.72 |
| Woodie | 1.04 | 1.25 | 1.42 | 1.63 | 1.80 | 2.01 | 2.18 |
| Fibonacci | 1.26 | 1.40 | 1.49 | 1.64 | 1.78 | 1.87 | 2.02 |
| Pivot points | S3 | S2 | S1 | PP | R1 | R2 | R3 |
|---|---|---|---|---|---|---|---|
| Standard | 0.62 | 1.10 | 1.76 | 2.24 | 2.90 | 3.38 | 4.04 |
| Camarilla | 2.12 | 2.22 | 2.33 | 2.43 | 2.54 | 2.64 | 2.74 |
| Woodie | 0.72 | 1.15 | 1.86 | 2.29 | 3.00 | 3.43 | 4.14 |
| Fibonacci | 1.10 | 1.53 | 1.80 | 2.24 | 2.67 | 2.94 | 3.38 |
Numerical data
The following are the details of the technical indicators and moving averages that were collected to generate this technical analysis:
| RSI (14): | 44.16 | |
| MACD (12,26,9): | -0.1100 | |
| Directional Movement: | -4.93 | |
| AROON (14): | -50.00 | |
| DEMA (21): | 1.57 | |
| Parabolic SAR (0,02-0,02-0,2): | 2.09 | |
| Elder Ray (13): | -0.06 | |
| Super Trend (3,10): | 2.06 | |
| Zig ZAG (10): | 1.65 | |
| VORTEX (21): | 0.9000 | |
| Stochastique (14,3,5): | 31.24 | |
| TEMA (21): | 1.51 | |
| Williams %R (14): | -50.00 | |
| Chande Momentum Oscillator (20): | -0.02 | |
| Repulse (5,40,3): | 7.0000 | |
| ROCnROLL: | -1 | |
| TRIX (15,9): | -0.9100 | |
| Courbe Coppock: | 16.92 |
| MA7: | 1.62 | |
| MA20: | 1.68 | |
| MA50: | 1.94 | |
| MA100: | 1.80 | |
| MAexp7: | 1.62 | |
| MAexp20: | 1.72 | |
| MAexp50: | 1.83 | |
| MAexp100: | 1.89 | |
| Price / MA7: | +3.70% | |
| Price / MA20: | -0% | |
| Price / MA50: | -13.40% | |
| Price / MA100: | -6.67% | |
| Price / MAexp7: | +3.70% | |
| Price / MAexp20: | -2.33% | |
| Price / MAexp50: | -8.20% | |
| Price / MAexp100: | -11.11% |
About author
Online


Add a comment
Comments
0 comments on the analysis INJECTIVE - INJ/USD - Daily