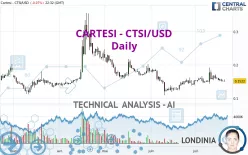
CARTESI - CTSI/USD - Daily - Technical analysis published on 07/20/2023 (GMT)
- 135
- 0
Click here for a new analysis!
- Timeframe : Daily
- - Analysis generated on
- Status : TARGET REACHED

Summary of the analysis

Additional analysis
Quotes
The CARTESI - CTSI/USD rating is 0.152200 USD. On the day, this instrument lost -0.07% with the lowest point at 0.149900 USD and the highest point at 0.156900 USD. The deviation from the price is +1.53% for the low point and -3.00% for the high point.A bullish opening was detected by the Central Gaps scanner. Buyers are trying to impose a bullish momentum in the very short term.
Bullish opening
Type : Bullish
Timeframe : Openning
A study of price movements over other periods shows the following variations:
Technical
Technical analysis of CARTESI - CTSI/USD in Daily shows a overall strongly bearish trend. 82.14% of the signals given by moving averages are bearish. The slightly bearish signals from short-term moving averages show that the overall trend is slowing down. The Central Indicators scanner detects a bearish signal on moving averages that could impact this trend:
Bearish trend reversal : Moving Average 100
Type : Bearish
Timeframe : Daily
The technical indicators are generally neutral. They do not provide relevant information on the direction of future price movements.
Caution: the Central Indicators scanner currently detects an excess:
Williams %R indicator is oversold : under -80
Type : Neutral
Timeframe : Daily
Parabolic SAR indicator bearish reversal
Type : Bearish
Timeframe : Daily
Ichimoku - Bearish crossover : Tenkan & Kijun
Type : Bearish
Timeframe : Daily
Momentum indicator is back under 0
Type : Bearish
Timeframe : Daily
No signals are given by Central Patterns, a market scanner specialised in chart patterns, resistances and supports.
Central Candlesticks, the scanner specialised in Japanese candlesticks, detects this inversion signal that could impact the current short-term trend:
Doji
Type : Neutral
Timeframe : Daily
| S2 | S1 | Price | R1 | R2 | R3 | |
|---|---|---|---|---|---|---|
| ProTrendLines | 0.118500 | 0.146527 | 0.152200 | 0.191333 | 0.235200 | 0.319500 |
| Change (%) | -22.14% | -3.73% | - | +25.71% | +54.53% | +109.92% |
| Change | -0.033700 | -0.005673 | - | +0.039133 | +0.083000 | +0.167300 |
| Level | Minor | Intermediate | - | Intermediate | Minor | Major |
To determine price objectives, it is also possible to use the pivot points. Here is the price position in relation to pivot points:
| Pivot points | S3 | S2 | S1 | PP | R1 | R2 | R3 |
|---|---|---|---|---|---|---|---|
| Standard | 0.146400 | 0.149100 | 0.150700 | 0.153400 | 0.155000 | 0.157700 | 0.159300 |
| Camarilla | 0.151118 | 0.151512 | 0.151906 | 0.152300 | 0.152694 | 0.153088 | 0.153483 |
| Woodie | 0.145850 | 0.148825 | 0.150150 | 0.153125 | 0.154450 | 0.157425 | 0.158750 |
| Fibonacci | 0.149100 | 0.150743 | 0.151757 | 0.153400 | 0.155043 | 0.156057 | 0.157700 |
| Pivot points | S3 | S2 | S1 | PP | R1 | R2 | R3 |
|---|---|---|---|---|---|---|---|
| Standard | 0.091033 | 0.117367 | 0.139233 | 0.165567 | 0.187433 | 0.213767 | 0.235633 |
| Camarilla | 0.147845 | 0.152263 | 0.156682 | 0.161100 | 0.165518 | 0.169937 | 0.174355 |
| Woodie | 0.088800 | 0.116250 | 0.137000 | 0.164450 | 0.185200 | 0.212650 | 0.233400 |
| Fibonacci | 0.117367 | 0.135779 | 0.147154 | 0.165567 | 0.183979 | 0.195354 | 0.213767 |
| Pivot points | S3 | S2 | S1 | PP | R1 | R2 | R3 |
|---|---|---|---|---|---|---|---|
| Standard | 0.033000 | 0.071200 | 0.112100 | 0.150300 | 0.191200 | 0.229400 | 0.270300 |
| Camarilla | 0.131248 | 0.138498 | 0.145749 | 0.153000 | 0.160251 | 0.167502 | 0.174753 |
| Woodie | 0.034350 | 0.071875 | 0.113450 | 0.150975 | 0.192550 | 0.230075 | 0.271650 |
| Fibonacci | 0.071200 | 0.101416 | 0.120084 | 0.150300 | 0.180516 | 0.199184 | 0.229400 |
Numerical data
The following is the status of the technical indicators and moving averages at the time of publication of this technical analysis:
| RSI (14): | 47.93 | |
| MACD (12,26,9): | 0.0008 | |
| Directional Movement: | 7.356011 | |
| AROON (14): | 0 | |
| DEMA (21): | 0.156621 | |
| Parabolic SAR (0,02-0,02-0,2): | 0.191900 | |
| Elder Ray (13): | -0.002431 | |
| Super Trend (3,10): | 0.128473 | |
| Zig ZAG (10): | 0.152300 | |
| VORTEX (21): | 1.0424 | |
| Stochastique (14,3,5): | 18.05 | |
| TEMA (21): | 0.158320 | |
| Williams %R (14): | -82.57 | |
| Chande Momentum Oscillator (20): | -0.000200 | |
| Repulse (5,40,3): | -4.4827 | |
| ROCnROLL: | 2 | |
| TRIX (15,9): | 0.2150 | |
| Courbe Coppock: | 3.77 |
| MA7: | 0.155843 | |
| MA20: | 0.156760 | |
| MA50: | 0.150890 | |
| MA100: | 0.177733 | |
| MAexp7: | 0.154997 | |
| MAexp20: | 0.155345 | |
| MAexp50: | 0.157238 | |
| MAexp100: | 0.160856 | |
| Price / MA7: | -2.34% | |
| Price / MA20: | -2.91% | |
| Price / MA50: | +0.87% | |
| Price / MA100: | -14.37% | |
| Price / MAexp7: | -1.80% | |
| Price / MAexp20: | -2.02% | |
| Price / MAexp50: | -3.20% | |
| Price / MAexp100: | -5.38% |
About author
Online


Add a comment
Comments
0 comments on the analysis CARTESI - CTSI/USD - Daily