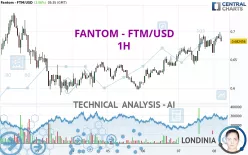
FANTOM - FTM/USD - 1H - Technical analysis published on 10/08/2024 (GMT)
- 149
- 0
Click here for a new analysis!
- Timeframe : 1H
- - Analysis generated on
- Status : INVALID

Summary of the analysis
Additional analysis
Quotes
The FANTOM - FTM/USD rating is 0.682456 USD. The price registered an increase of +3.06% on the session and was traded between 0.662173 USD and 0.699069 USD over the period. The price is currently at +3.06% from its lowest and -2.38% from its highest.A bearish opening was detected by the Central Gaps scanner. Sellers are trying to impose a bearish trend in the very short term.
Bearish opening
Type : Bearish
Timeframe : Openning
Here is a more detailed summary of the historical variations registered by FANTOM - FTM/USD:
New HIGH record (1st january)
Type : Bullish
Timeframe : Weekly
Technical
Technical analysis of FANTOM - FTM/USD in 1H shows a strongly overall bullish trend. The signals given by the moving averages are 92.86% bullish. This strong bullish trend is confirmed by the strong signals currently being given by short-term moving averages. There is no crossing of moving average by the price or crossing of moving averages between themselves.
The probability of a further increase are moderate given the direction of the technical indicators.
Caution: the Central Indicators scanner currently detects an excess:
CCI indicator: bearish divergence
Type : Bearish
Timeframe : 1 hour
Price is back over the pivot point
Type : Bullish
Timeframe : Weekly
Momentum indicator is back over 0
Type : Bullish
Timeframe : 1 hour
An analysis of the price chart with the Central Patterns scanner (detector of chart patterns and resistances and supports) shows several results that can have an impact on the price change:
Near resistance of channel
Type : Bearish
Timeframe : 1 hour
Near resistance of triangle
Type : Bearish
Timeframe : 1 hour
The Central Candlesticks scanner which studies Japanese candlesticks did not detect anything.
| S3 | S2 | S1 | Price | R1 | R2 | R3 | |
|---|---|---|---|---|---|---|---|
| ProTrendLines | 0.634137 | 0.657976 | 0.673046 | 0.682456 | 0.695222 | 0.712782 | 0.732293 |
| Change (%) | -7.08% | -3.59% | -1.38% | - | +1.87% | +4.44% | +7.30% |
| Change | -0.048319 | -0.024480 | -0.009410 | - | +0.012766 | +0.030326 | +0.049837 |
| Level | Major | Minor | Minor | - | Intermediate | Intermediate | Minor |
To determine price objectives, it is also possible to use the pivot points. Here is the price position in relation to pivot points:
| Pivot points | S3 | S2 | S1 | PP | R1 | R2 | R3 |
|---|---|---|---|---|---|---|---|
| Standard | 0.583606 | 0.612533 | 0.637367 | 0.666294 | 0.691128 | 0.720055 | 0.744889 |
| Camarilla | 0.647416 | 0.652344 | 0.657272 | 0.662200 | 0.667128 | 0.672056 | 0.676984 |
| Woodie | 0.581559 | 0.611510 | 0.635320 | 0.665271 | 0.689081 | 0.719032 | 0.742842 |
| Fibonacci | 0.612533 | 0.633070 | 0.645758 | 0.666294 | 0.686831 | 0.699519 | 0.720055 |
| Pivot points | S3 | S2 | S1 | PP | R1 | R2 | R3 |
|---|---|---|---|---|---|---|---|
| Standard | 0.367870 | 0.477587 | 0.543940 | 0.653657 | 0.720010 | 0.829727 | 0.896080 |
| Camarilla | 0.561873 | 0.578013 | 0.594152 | 0.610292 | 0.626432 | 0.642572 | 0.658711 |
| Woodie | 0.346187 | 0.466746 | 0.522257 | 0.642816 | 0.698327 | 0.818886 | 0.874397 |
| Fibonacci | 0.477587 | 0.544846 | 0.586399 | 0.653657 | 0.720916 | 0.762469 | 0.829727 |
| Pivot points | S3 | S2 | S1 | PP | R1 | R2 | R3 |
|---|---|---|---|---|---|---|---|
| Standard | 0.077963 | 0.217701 | 0.455511 | 0.595249 | 0.833059 | 0.972797 | 1.210607 |
| Camarilla | 0.589496 | 0.624105 | 0.658713 | 0.693322 | 0.727931 | 0.762539 | 0.797148 |
| Woodie | 0.127000 | 0.242219 | 0.504548 | 0.619767 | 0.882096 | 0.997315 | 1.259644 |
| Fibonacci | 0.217701 | 0.361924 | 0.451025 | 0.595249 | 0.739472 | 0.828573 | 0.972797 |
Numerical data
The following is the status of the technical indicators and moving averages at the time of publication of this technical analysis:
| RSI (14): | 60.29 | |
| MACD (12,26,9): | 0.0084 | |
| Directional Movement: | 18.715111 | |
| AROON (14): | 42.857143 | |
| DEMA (21): | 0.688509 | |
| Parabolic SAR (0,02-0,02-0,2): | 0.657258 | |
| Elder Ray (13): | 0.008695 | |
| Super Trend (3,10): | 0.656112 | |
| Zig ZAG (10): | 0.689949 | |
| VORTEX (21): | 1.1398 | |
| Stochastique (14,3,5): | 74.64 | |
| TEMA (21): | 0.688764 | |
| Williams %R (14): | -27.12 | |
| Chande Momentum Oscillator (20): | 0.014278 | |
| Repulse (5,40,3): | -0.4470 | |
| ROCnROLL: | 1 | |
| TRIX (15,9): | 0.1722 | |
| Courbe Coppock: | 3.32 |
| MA7: | 0.643462 | |
| MA20: | 0.660401 | |
| MA50: | 0.540989 | |
| MA100: | 0.486764 | |
| MAexp7: | 0.684786 | |
| MAexp20: | 0.677403 | |
| MAexp50: | 0.662626 | |
| MAexp100: | 0.653709 | |
| Price / MA7: | +6.06% | |
| Price / MA20: | +3.34% | |
| Price / MA50: | +26.15% | |
| Price / MA100: | +40.20% | |
| Price / MAexp7: | -0.34% | |
| Price / MAexp20: | +0.75% | |
| Price / MAexp50: | +2.99% | |
| Price / MAexp100: | +4.40% |
About author

Online


Add a comment
Comments
0 comments on the analysis FANTOM - FTM/USD - 1H