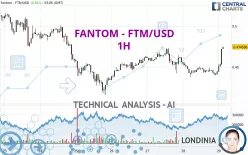
FANTOM - FTM/USD - 1H - Technical analysis published on 07/29/2024 (GMT)
- 155
- 0
Click here for a new analysis!
- Timeframe : 1H
- - Analysis generated on
- Status : INVALID

Summary of the analysis
Additional analysis
Quotes
FANTOM - FTM/USD rating 0.474596 USD. The price registered an increase of +6.81% on the session and was between 0.443622 USD and 0.474596 USD. This implies that the price is at +6.98% from its lowest and at 0% from its highest.A bearish opening was detected by the Central Gaps scanner. Sellers are trying to impose a bearish trend in the very short term.
Bearish opening
Type : Bearish
Timeframe : Openning
So that you have an overall view of the price change, here is a table showing the variations over several periods:
Technical
Technical analysis of FANTOM - FTM/USD in 1H shows an overall bullish trend. 75.00% of the signals given by moving averages are bullish. This bullish trend is supported by the strong bullish signals given by short-term moving averages. An assessment of moving averages reveals several bearish and bullish signals:
Bullish trend reversal : Moving Average 50
Type : Bullish
Timeframe : 1 hour
Bullish trend reversal : Moving Average 100
Type : Bullish
Timeframe : 1 hour
Bullish trend reversal : adaptative moving average 100
Type : Bullish
Timeframe : 1 hour
Bearish price crossover with adaptative moving average 100
Type : Bearish
Timeframe : 1 hour
Technical indicators are strongly bullish, suggesting that the price increase should continue.
Caution: the Central Indicators scanner currently detects an excess:
RSI indicator is overbought : over 70
Type : Neutral
Timeframe : 1 hour
CCI indicator is overbought : over 100
Type : Neutral
Timeframe : 1 hour
Williams %R indicator is overbought : over -20
Type : Neutral
Timeframe : 1 hour
Pivot points : price is over resistance 2
Type : Neutral
Timeframe : 1 hour
Ichimoku : price is over the cloud
Type : Bullish
Timeframe : 1 hour
MACD indicator is back over 0
Type : Bullish
Timeframe : 1 hour
The analysis of the price chart with Central Patterns scanners does not return any result.
The Central Candlesticks scanner, specialised in Japanese candlesticks, did not identify any signals.
| S3 | S2 | S1 | Price | R1 | R2 | R3 | |
|---|---|---|---|---|---|---|---|
| ProTrendLines | 0.415228 | 0.427151 | 0.446031 | 0.474596 | 0.474708 | 0.489855 | 0.501069 |
| Change (%) | -12.51% | -10.00% | -6.02% | - | +0.02% | +3.22% | +5.58% |
| Change | -0.059368 | -0.047445 | -0.028565 | - | +0.000112 | +0.015259 | +0.026473 |
| Level | Major | Minor | Minor | - | Intermediate | Minor | Intermediate |
To determine price objectives, it is also possible to use the pivot points. Here is the price position in relation to pivot points:
| Pivot points | S3 | S2 | S1 | PP | R1 | R2 | R3 |
|---|---|---|---|---|---|---|---|
| Standard | 0.418111 | 0.427992 | 0.436166 | 0.446047 | 0.454221 | 0.464102 | 0.472276 |
| Camarilla | 0.439376 | 0.441031 | 0.442686 | 0.444341 | 0.445996 | 0.447651 | 0.449306 |
| Woodie | 0.417259 | 0.427565 | 0.435314 | 0.445620 | 0.453369 | 0.463675 | 0.471424 |
| Fibonacci | 0.427992 | 0.434889 | 0.439150 | 0.446047 | 0.452944 | 0.457205 | 0.464102 |
| Pivot points | S3 | S2 | S1 | PP | R1 | R2 | R3 |
|---|---|---|---|---|---|---|---|
| Standard | 0.268465 | 0.341874 | 0.398901 | 0.472310 | 0.529337 | 0.602746 | 0.659773 |
| Camarilla | 0.420057 | 0.432014 | 0.443970 | 0.455927 | 0.467884 | 0.479840 | 0.491797 |
| Woodie | 0.260273 | 0.337779 | 0.390709 | 0.468215 | 0.521145 | 0.598651 | 0.651581 |
| Fibonacci | 0.341874 | 0.391701 | 0.422484 | 0.472310 | 0.522137 | 0.552920 | 0.602746 |
| Pivot points | S3 | S2 | S1 | PP | R1 | R2 | R3 |
|---|---|---|---|---|---|---|---|
| Standard | 0.252227 | 0.363548 | 0.476220 | 0.587541 | 0.700213 | 0.811534 | 0.924206 |
| Camarilla | 0.527293 | 0.547826 | 0.568358 | 0.588891 | 0.609424 | 0.629956 | 0.650489 |
| Woodie | 0.252902 | 0.363886 | 0.476895 | 0.587879 | 0.700888 | 0.811872 | 0.924881 |
| Fibonacci | 0.363548 | 0.449114 | 0.501976 | 0.587541 | 0.673107 | 0.725969 | 0.811534 |
Numerical data
The following are the details of the technical indicators and moving averages that were collected to generate this technical analysis:
| RSI (14): | 70.82 | |
| MACD (12,26,9): | 0.0003 | |
| Directional Movement: | 21.920669 | |
| AROON (14): | 28.571429 | |
| DEMA (21): | 0.448311 | |
| Parabolic SAR (0,02-0,02-0,2): | 0.440561 | |
| Elder Ray (13): | 0.009764 | |
| Super Trend (3,10): | 0.443779 | |
| Zig ZAG (10): | 0.465215 | |
| VORTEX (21): | 1.1725 | |
| Stochastique (14,3,5): | 90.91 | |
| TEMA (21): | 0.451179 | |
| Williams %R (14): | 0.00 | |
| Chande Momentum Oscillator (20): | 0.025100 | |
| Repulse (5,40,3): | 5.9902 | |
| ROCnROLL: | 1 | |
| TRIX (15,9): | -0.0645 | |
| Courbe Coppock: | 1.83 |
| MA7: | 0.459199 | |
| MA20: | 0.485830 | |
| MA50: | 0.529252 | |
| MA100: | 0.642951 | |
| MAexp7: | 0.452661 | |
| MAexp20: | 0.448691 | |
| MAexp50: | 0.450922 | |
| MAexp100: | 0.457024 | |
| Price / MA7: | +3.35% | |
| Price / MA20: | -2.31% | |
| Price / MA50: | -10.33% | |
| Price / MA100: | -26.18% | |
| Price / MAexp7: | +4.85% | |
| Price / MAexp20: | +5.77% | |
| Price / MAexp50: | +5.25% | |
| Price / MAexp100: | +3.84% |
About author

Online


Add a comment
Comments
0 comments on the analysis FANTOM - FTM/USD - 1H