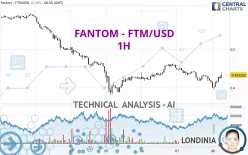
FANTOM - FTM/USD - 1H - Technical analysis published on 07/08/2024 (GMT)
- 235
- 0
- Timeframe : 1H
- - Analysis generated on
- Status : NEUTRAL

Summary of the analysis
Additional analysis
Quotes
FANTOM - FTM/USD rating 0.433102 USD. The price has increased by +4.30% since the last closing with the lowest point at 0.394515 USD and the highest point at 0.439705 USD. The deviation from the price is +9.78% for the low point and -1.50% for the high point.The Central Gaps scanner detects a bearish opening marking the presence of sellers ahead of buyers at the opening but not sufficiently marked to allow the price to register a quotation gap.
Bearish opening
Type : Bearish
Timeframe : Openning
So that you have an overall view of the price change, here is a table showing the variations over several periods:
Near a new LOW record (1 month)
Type : Bearish
Timeframe : Weekly
Technical
Technical analysis of this 1H chart of FANTOM - FTM/USD indicates that the overall trend is slightly bearish. 57.14% of the signals given by moving averages are bearish. Caution: the slightly bullish signals currently given by short-term moving averages could cause a reversal of the trend. An assessment of moving averages reveals several bullish signals that could impact this trend:
Bullish price crossover with Moving Average 50
Type : Bullish
Timeframe : 1 hour
Bullish price crossover with Moving Average 100
Type : Bullish
Timeframe : 1 hour
Bullish price crossover with adaptative moving average 50
Type : Bullish
Timeframe : 1 hour
Bullish price crossover with adaptative moving average 100
Type : Bullish
Timeframe : 1 hour
In fact, 13 technical indicators on 18 studied are currently bullish. Caution: the Central Indicators scanner currently detects an excess:
Williams %R indicator is overbought : over -20
Type : Neutral
Timeframe : 1 hour
RSI indicator is back over 50
Type : Bullish
Timeframe : 1 hour
Aroon indicator bullish trend
Type : Bullish
Timeframe : 1 hour
Price is back over the pivot point
Type : Bullish
Timeframe : 1 hour
Momentum indicator is back over 0
Type : Bullish
Timeframe : 1 hour
Central Patterns, the market scanner focusing on chart patterns, resistances and supports found this result:
Resistance of channel is broken
Type : Bullish
Timeframe : 1 hour
No result was found by the Central Candlesticks scanner on Japanese candlesticks.
| S3 | S2 | S1 | Price | R1 | R2 | R3 | |
|---|---|---|---|---|---|---|---|
| ProTrendLines | 0.329001 | 0.390846 | 0.431099 | 0.433102 | 0.451728 | 0.535705 | 0.594360 |
| Change (%) | -24.04% | -9.76% | -0.46% | - | +4.30% | +23.69% | +37.23% |
| Change | -0.104101 | -0.042256 | -0.002003 | - | +0.018626 | +0.102603 | +0.161258 |
| Level | Minor | Major | Minor | - | Minor | Intermediate | Intermediate |
To determine price objectives, it is also possible to use the pivot points. Here is the price position in relation to pivot points:
| Pivot points | S3 | S2 | S1 | PP | R1 | R2 | R3 |
|---|---|---|---|---|---|---|---|
| Standard | 0.359070 | 0.385347 | 0.400294 | 0.426571 | 0.441518 | 0.467795 | 0.482742 |
| Camarilla | 0.403905 | 0.407684 | 0.411463 | 0.415242 | 0.419021 | 0.422800 | 0.426579 |
| Woodie | 0.353406 | 0.382515 | 0.394630 | 0.423739 | 0.435854 | 0.464963 | 0.477078 |
| Fibonacci | 0.385347 | 0.401094 | 0.410823 | 0.426571 | 0.442318 | 0.452047 | 0.467795 |
| Pivot points | S3 | S2 | S1 | PP | R1 | R2 | R3 |
|---|---|---|---|---|---|---|---|
| Standard | 0.122487 | 0.251482 | 0.351409 | 0.480404 | 0.580331 | 0.709326 | 0.809253 |
| Camarilla | 0.388382 | 0.409366 | 0.430351 | 0.451335 | 0.472320 | 0.493304 | 0.514289 |
| Woodie | 0.107952 | 0.244215 | 0.336874 | 0.473137 | 0.565796 | 0.702059 | 0.794718 |
| Fibonacci | 0.251482 | 0.338931 | 0.392956 | 0.480404 | 0.567853 | 0.621878 | 0.709326 |
| Pivot points | S3 | S2 | S1 | PP | R1 | R2 | R3 |
|---|---|---|---|---|---|---|---|
| Standard | 0.043743 | 0.259306 | 0.424099 | 0.639662 | 0.804455 | 1.020018 | 1.184811 |
| Camarilla | 0.484293 | 0.519159 | 0.554025 | 0.588891 | 0.623757 | 0.658623 | 0.693489 |
| Woodie | 0.018357 | 0.246614 | 0.398713 | 0.626970 | 0.779069 | 1.007326 | 1.159425 |
| Fibonacci | 0.259306 | 0.404602 | 0.494366 | 0.639662 | 0.784958 | 0.874722 | 1.020018 |
Numerical data
The following is the status of technical indicators and moving averages registered at the time this technical analysis was created:
| RSI (14): | 55.72 | |
| MACD (12,26,9): | -0.0038 | |
| Directional Movement: | 2.569963 | |
| AROON (14): | 35.714286 | |
| DEMA (21): | 0.419033 | |
| Parabolic SAR (0,02-0,02-0,2): | 0.396580 | |
| Elder Ray (13): | 0.006855 | |
| Super Trend (3,10): | 0.401850 | |
| Zig ZAG (10): | 0.437911 | |
| VORTEX (21): | 0.9406 | |
| Stochastique (14,3,5): | 86.74 | |
| TEMA (21): | 0.418743 | |
| Williams %R (14): | -1.88 | |
| Chande Momentum Oscillator (20): | 0.006361 | |
| Repulse (5,40,3): | 5.2826 | |
| ROCnROLL: | 1 | |
| TRIX (15,9): | -0.1961 | |
| Courbe Coppock: | 3.67 |
| MA7: | 0.465292 | |
| MA20: | 0.533830 | |
| MA50: | 0.663442 | |
| MA100: | 0.712666 | |
| MAexp7: | 0.424162 | |
| MAexp20: | 0.424521 | |
| MAexp50: | 0.432186 | |
| MAexp100: | 0.449246 | |
| Price / MA7: | -6.92% | |
| Price / MA20: | -18.87% | |
| Price / MA50: | -34.72% | |
| Price / MA100: | -39.23% | |
| Price / MAexp7: | +2.11% | |
| Price / MAexp20: | +2.02% | |
| Price / MAexp50: | +0.21% | |
| Price / MAexp100: | -3.59% |
About author

Online


Add a comment
Comments
0 comments on the analysis FANTOM - FTM/USD - 1H