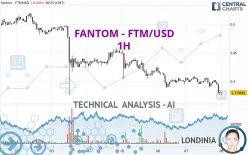
FANTOM - FTM/USD - 1H - Technical analysis published on 01/08/2024 (GMT)
- 219
- 0
Click here for a new analysis!
- Timeframe : 1H
- - Analysis generated on
- Status : TARGET REACHED

Summary of the analysis
Additional analysis
Quotes
The FANTOM - FTM/USD price is 0.379881 USD. The price is lower by -0.04% since the last closing with the lowest point at 0.375401 USD and the highest point at 0.381071 USD. The deviation from the price is +1.19% for the low point and -0.31% for the high point.The Central Gaps scanner detects a bullish opening. A small advantage for buyers in the very short term.
Bullish opening
Type : Bullish
Timeframe : Openning
Here is a more detailed summary of the historical variations registered by FANTOM - FTM/USD:
Near a new LOW record (1st january)
Type : Bearish
Timeframe : Weekly
The Central Volumes scanner detects abnormal volumes on the asset:
Abnormal volumes
Timeframe : 20 days
Abnormal volumes
Timeframe : 50 days
Technical
Technical analysis of this 1H chart of FANTOM - FTM/USD indicates that the overall trend is strongly bearish. 92.86% of the signals given by moving averages are bearish. This strongly bearish trend is supported by the strong bearish signals given by short-term moving averages. There is no crossing of moving average by the price or crossing of moving averages between themselves.
In fact, 13 technical indicators on 18 studied are currently bearish. Caution: the Central Indicators scanner currently detects an excess:
CCI indicator is oversold : under -100
Type : Neutral
Timeframe : 1 hour
Previous candle closed under Bollinger bands
Type : Neutral
Timeframe : 1 hour
Williams %R indicator is oversold : under -80
Type : Neutral
Timeframe : 1 hour
An analysis of the price chart with the Central Patterns scanner (detector of chart patterns and resistances and supports) shows a result that can have an impact on the price change:
Near resistance of channel
Type : Bearish
Timeframe : 1 hour
The Central Candlesticks scanner which studies Japanese candlesticks did not detect anything.
| S3 | S2 | S1 | Price | R1 | R2 | R3 | |
|---|---|---|---|---|---|---|---|
| ProTrendLines | 0.240880 | 0.282803 | 0.375250 | 0.379881 | 0.404418 | 0.439690 | 0.465077 |
| Change (%) | -36.59% | -25.55% | -1.22% | - | +6.46% | +15.74% | +22.43% |
| Change | -0.139001 | -0.097078 | -0.004631 | - | +0.024537 | +0.059809 | +0.085196 |
| Level | Minor | Minor | Minor | - | Intermediate | Minor | Intermediate |
Attention could also be paid to pivot points to set price objectives:
| Pivot points | S3 | S2 | S1 | PP | R1 | R2 | R3 |
|---|---|---|---|---|---|---|---|
| Standard | 0.334299 | 0.355052 | 0.367542 | 0.388295 | 0.400785 | 0.421538 | 0.434028 |
| Camarilla | 0.370890 | 0.373938 | 0.376985 | 0.380032 | 0.383079 | 0.386127 | 0.389174 |
| Woodie | 0.330168 | 0.352986 | 0.363411 | 0.386229 | 0.396654 | 0.419472 | 0.429897 |
| Fibonacci | 0.355052 | 0.367751 | 0.375596 | 0.388295 | 0.400994 | 0.408839 | 0.421538 |
| Pivot points | S3 | S2 | S1 | PP | R1 | R2 | R3 |
|---|---|---|---|---|---|---|---|
| Standard | 0.199620 | 0.287435 | 0.343848 | 0.431663 | 0.488076 | 0.575891 | 0.632304 |
| Camarilla | 0.360598 | 0.373819 | 0.387040 | 0.400261 | 0.413482 | 0.426703 | 0.439924 |
| Woodie | 0.183919 | 0.279585 | 0.328147 | 0.423813 | 0.472375 | 0.568041 | 0.616603 |
| Fibonacci | 0.287435 | 0.342530 | 0.376568 | 0.431663 | 0.486758 | 0.520796 | 0.575891 |
| Pivot points | S3 | S2 | S1 | PP | R1 | R2 | R3 |
|---|---|---|---|---|---|---|---|
| Standard | 0.050047 | 0.172016 | 0.322942 | 0.444911 | 0.595837 | 0.717806 | 0.868732 |
| Camarilla | 0.398822 | 0.423837 | 0.448853 | 0.473868 | 0.498883 | 0.523899 | 0.548914 |
| Woodie | 0.064526 | 0.179255 | 0.337421 | 0.452150 | 0.610316 | 0.725045 | 0.883211 |
| Fibonacci | 0.172016 | 0.276262 | 0.340665 | 0.444911 | 0.549157 | 0.613560 | 0.717806 |
Numerical data
The following is the status of the technical indicators and moving averages at the time of publication of this technical analysis:
| RSI (14): | 31.85 | |
| MACD (12,26,9): | -0.0053 | |
| Directional Movement: | -27.060425 | |
| AROON (14): | -64.285714 | |
| DEMA (21): | 0.388462 | |
| Parabolic SAR (0,02-0,02-0,2): | 0.403785 | |
| Elder Ray (13): | -0.011771 | |
| Super Trend (3,10): | 0.399603 | |
| Zig ZAG (10): | 0.380925 | |
| VORTEX (21): | 0.8483 | |
| Stochastique (14,3,5): | 13.35 | |
| TEMA (21): | 0.386941 | |
| Williams %R (14): | -82.87 | |
| Chande Momentum Oscillator (20): | -0.019031 | |
| Repulse (5,40,3): | -2.1000 | |
| ROCnROLL: | 2 | |
| TRIX (15,9): | -0.1118 | |
| Courbe Coppock: | 5.99 |
| MA7: | 0.422080 | |
| MA20: | 0.471159 | |
| MA50: | 0.397247 | |
| MA100: | 0.316967 | |
| MAexp7: | 0.387382 | |
| MAexp20: | 0.394541 | |
| MAexp50: | 0.403992 | |
| MAexp100: | 0.419556 | |
| Price / MA7: | -10.00% | |
| Price / MA20: | -19.37% | |
| Price / MA50: | -4.37% | |
| Price / MA100: | +19.85% | |
| Price / MAexp7: | -1.94% | |
| Price / MAexp20: | -3.72% | |
| Price / MAexp50: | -5.97% | |
| Price / MAexp100: | -9.46% |
About author

Online


Add a comment
Comments
0 comments on the analysis FANTOM - FTM/USD - 1H