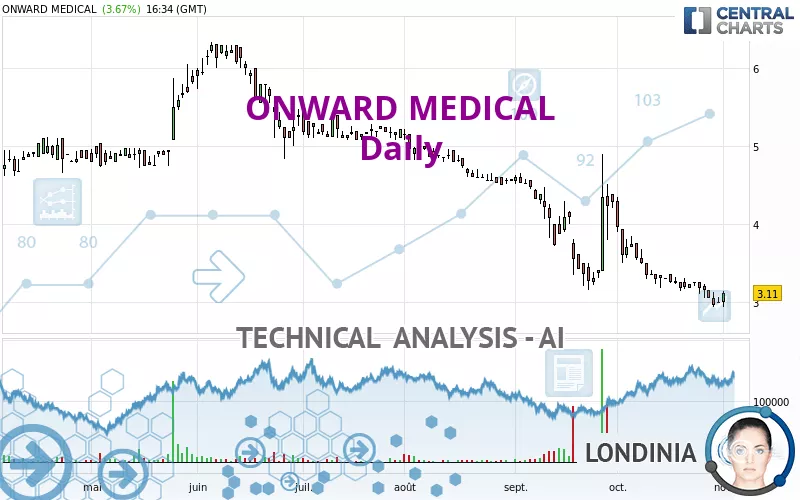
ONWARD MEDICAL - Daily - Technical analysis published on 11/02/2023 (GMT)
- 108
- 0
Click here for a new analysis!
- Timeframe : Daily
- - Analysis generated on
- Status : INVALID

Summary of the analysis

Additional analysis
Quotes
ONWARD MEDICAL rating 3.11 EUR. The price registered an increase of +3.67% on the session with the lowest point at 2.93 EUR and the highest point at 3.13 EUR. The deviation from the price is +6.14% for the low point and -0.64% for the high point.A study of price movements over other periods shows the following variations:
New LOW record (5 years)
Type : Bearish
Timeframe : Weekly
New LOW record (1 year)
Type : Bearish
Timeframe : Weekly
New LOW record (1st january)
Type : Bearish
Timeframe : Weekly
New LOW record (1 month)
Type : Bearish
Timeframe : Weekly
Abnormal volumes on ONWARD MEDICAL were detected by the Central Volumes scanner:
Abnormal volumes
Timeframe : 50 days
Technical
A technical analysis in Daily of this ONWARD MEDICAL chart shows a sharp bearish trend. The signals given by moving averages are 92.86% bearish. This strong bearish trend is confirmed by the strong signals currently being given by short-term moving averages. There is no crossing of moving average by the price or crossing of moving averages between themselves.
An assessment of technical indicators does not currently provide any relevant information on the direction of future price movements.
Caution: the Central Indicators scanner currently detects an excess:
CCI indicator is oversold : under -100
Type : Neutral
Timeframe : Daily
Pivot points : price is over resistance 3
Type : Neutral
Timeframe : Daily
The Central Patterns scanner, which studies chart patterns, resistances and supports, has identified these signals:
Near horizontal resistance
Type : Bearish
Timeframe : Daily
Near support of channel
Type : Bullish
Timeframe : Daily
No result was found by the Central Candlesticks scanner on Japanese candlesticks.
| Price | R1 | R2 | R3 | |
|---|---|---|---|---|
| ProTrendLines | 3.11 | 3.26 | 4.67 | 5.10 |
| Change (%) | - | +4.82% | +50.16% | +63.99% |
| Change | - | +0.15 | +1.56 | +1.99 |
| Level | - | Intermediate | Intermediate | Major |
To determine price objectives, it is also possible to use the pivot points. Here is the price position in relation to pivot points:
| Pivot points | S3 | S2 | S1 | PP | R1 | R2 | R3 |
|---|---|---|---|---|---|---|---|
| Standard | 2.78 | 2.86 | 2.98 | 3.06 | 3.18 | 3.26 | 3.38 |
| Camarilla | 3.06 | 3.07 | 3.09 | 3.11 | 3.13 | 3.15 | 3.17 |
| Woodie | 2.81 | 2.87 | 3.01 | 3.07 | 3.21 | 3.27 | 3.41 |
| Fibonacci | 2.86 | 2.93 | 2.98 | 3.06 | 3.13 | 3.18 | 3.26 |
| Pivot points | S3 | S2 | S1 | PP | R1 | R2 | R3 |
|---|---|---|---|---|---|---|---|
| Standard | 2.78 | 2.92 | 2.98 | 3.12 | 3.18 | 3.32 | 3.38 |
| Camarilla | 3.00 | 3.01 | 3.03 | 3.05 | 3.07 | 3.09 | 3.11 |
| Woodie | 2.75 | 2.90 | 2.95 | 3.10 | 3.15 | 3.30 | 3.35 |
| Fibonacci | 2.92 | 2.99 | 3.04 | 3.12 | 3.19 | 3.24 | 3.32 |
| Pivot points | S3 | S2 | S1 | PP | R1 | R2 | R3 |
|---|---|---|---|---|---|---|---|
| Standard | 1.08 | 2.01 | 2.50 | 3.43 | 3.92 | 4.85 | 5.34 |
| Camarilla | 2.61 | 2.74 | 2.87 | 3.00 | 3.13 | 3.26 | 3.39 |
| Woodie | 0.87 | 1.90 | 2.29 | 3.32 | 3.71 | 4.74 | 5.13 |
| Fibonacci | 2.01 | 2.55 | 2.88 | 3.43 | 3.97 | 4.30 | 4.85 |
Numerical data
The following is the status of the technical indicators and moving averages at the time of publication of this technical analysis:
| RSI (14): | 37.88 | |
| MACD (12,26,9): | -0.2100 | |
| Directional Movement: | -12.81 | |
| AROON (14): | -85.71 | |
| DEMA (21): | 2.99 | |
| Parabolic SAR (0,02-0,02-0,2): | 3.54 | |
| Elder Ray (13): | -0.14 | |
| Super Trend (3,10): | 3.51 | |
| Zig ZAG (10): | 3.11 | |
| VORTEX (21): | 0.7800 | |
| Stochastique (14,3,5): | 21.92 | |
| TEMA (21): | 3.00 | |
| Williams %R (14): | -57.14 | |
| Chande Momentum Oscillator (20): | -0.19 | |
| Repulse (5,40,3): | 1.1000 | |
| ROCnROLL: | 2 | |
| TRIX (15,9): | -0.8500 | |
| Courbe Coppock: | 18.79 |
| MA7: | 3.10 | |
| MA20: | 3.26 | |
| MA50: | 3.75 | |
| MA100: | 4.45 | |
| MAexp7: | 3.09 | |
| MAexp20: | 3.28 | |
| MAexp50: | 3.71 | |
| MAexp100: | 4.20 | |
| Price / MA7: | +0.32% | |
| Price / MA20: | -4.60% | |
| Price / MA50: | -17.07% | |
| Price / MA100: | -30.11% | |
| Price / MAexp7: | +0.65% | |
| Price / MAexp20: | -5.18% | |
| Price / MAexp50: | -16.17% | |
| Price / MAexp100: | -25.95% |
News
The latest news and videos published on ONWARD MEDICAL at the time of the analysis were as follows:
- ONWARD Schedules Webcast to Provide Third Quarter 2023 Business Update
- ONWARD® Reports 2023 Half Year Results and Business Update
- ONWARD® Launches Partnership with Service-Disabled Veteran-Owned Business to Access U.S. Federal Health Market
- ONWARD Announces Results of Annual General Meeting of Shareholders
- ONWARD Schedules Webcast to Provide First Quarter Business Update
About author
Online


Add a comment
Comments
0 comments on the analysis ONWARD MEDICAL - Daily