HUNTINGTON BANCSHARES INC. - Daily - Technical analysis published on 06/06/2024 (GMT)
- 121
- 0
Click here for a new analysis!
- Timeframe : Daily
- - Analysis generated on
- Status : TARGET REACHED
Summary of the analysis

Additional analysis
Quotes
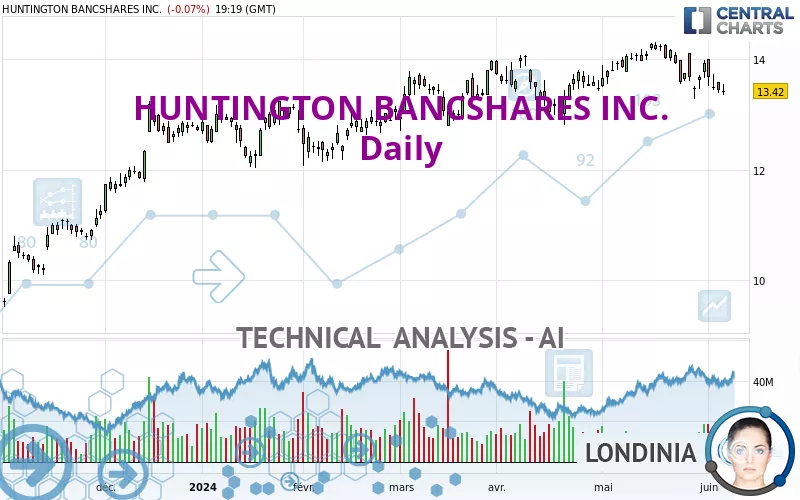
The HUNTINGTON BANCSHARES INC. rating is 13.42 USD. The price registered a decrease of -0.07% on the session with the lowest point at 13.35 USD and the highest point at 13.54 USD. The deviation from the price is +0.52% for the low point and -0.89% for the high point.The Central Gaps scanner detects a bearish opening marking the presence of sellers ahead of buyers at the opening but not sufficiently marked to allow the price to register a quotation gap.
Bearish opening
Type : Bearish
Timeframe : Openning
Here is a more detailed summary of the historical variations registered by HUNTINGTON BANCSHARES INC.:
Near a new LOW record (1 month)
Type : Bearish
Timeframe : Weekly
Technical
Technical analysis of HUNTINGTON BANCSHARES INC. in Daily shows an overall slightly bullish trend. 57.14% of the signals given by moving averages are bullish. Caution: a reversal of the trend could be possible given the strong bearish signals of short-term moving averages. The Central Indicators market scanner currently does not detect any result that concerns moving averages.
In fact, only 9 technical indicators out of 18 studied are currently bearish. Caution: the Central Indicators scanner currently detects an excess:
CCI indicator is oversold : under -100
Type : Neutral
Timeframe : Daily
CCI indicator: bullish divergence
Type : Bullish
Timeframe : Daily
Williams %R indicator is oversold : under -80
Type : Neutral
Timeframe : Daily
Price is back under the pivot point
Type : Bearish
Timeframe : Weekly
The Central Patterns scanner, which studies chart patterns, resistances and supports, has identified these signals:
Near horizontal support
Type : Bullish
Timeframe : Daily
Support of channel is broken
Type : Bearish
Timeframe : Daily
The Central Candlesticks scanner, specialised in Japanese candlesticks, did not identify any signals.
| S3 | S2 | S1 | Price | R1 | R2 | R3 | |
|---|---|---|---|---|---|---|---|
| ProTrendLines | 10.81 | 12.42 | 12.95 | 13.42 | 13.76 | 14.54 | 15.71 |
| Change (%) | -19.45% | -7.45% | -3.50% | - | +2.53% | +8.35% | +17.06% |
| Change | -2.61 | -1.00 | -0.47 | - | +0.34 | +1.12 | +2.29 |
| Level | Major | Major | Intermediate | - | Intermediate | Major | Major |
Pivot points can also be used to set your price objectives. Here is the price situation in relation to pivot points:
| Pivot points | S3 | S2 | S1 | PP | R1 | R2 | R3 |
|---|---|---|---|---|---|---|---|
| Standard | 13.16 | 13.27 | 13.35 | 13.46 | 13.54 | 13.65 | 13.73 |
| Camarilla | 13.38 | 13.40 | 13.41 | 13.43 | 13.45 | 13.47 | 13.48 |
| Woodie | 13.15 | 13.26 | 13.34 | 13.45 | 13.53 | 13.64 | 13.72 |
| Fibonacci | 13.27 | 13.34 | 13.39 | 13.46 | 13.53 | 13.58 | 13.65 |
| Pivot points | S3 | S2 | S1 | PP | R1 | R2 | R3 |
|---|---|---|---|---|---|---|---|
| Standard | 12.61 | 12.95 | 13.43 | 13.77 | 14.25 | 14.59 | 15.07 |
| Camarilla | 13.70 | 13.77 | 13.85 | 13.92 | 14.00 | 14.07 | 14.15 |
| Woodie | 12.69 | 12.99 | 13.51 | 13.81 | 14.33 | 14.63 | 15.15 |
| Fibonacci | 12.95 | 13.26 | 13.45 | 13.77 | 14.08 | 14.27 | 14.59 |
| Pivot points | S3 | S2 | S1 | PP | R1 | R2 | R3 |
|---|---|---|---|---|---|---|---|
| Standard | 12.35 | 12.81 | 13.37 | 13.83 | 14.39 | 14.85 | 15.41 |
| Camarilla | 13.64 | 13.73 | 13.83 | 13.92 | 14.01 | 14.11 | 14.20 |
| Woodie | 12.39 | 12.84 | 13.41 | 13.86 | 14.43 | 14.88 | 15.45 |
| Fibonacci | 12.81 | 13.20 | 13.44 | 13.83 | 14.22 | 14.46 | 14.85 |
Numerical data
The following is the status of the technical indicators and moving averages at the time of publication of this technical analysis:
| RSI (14): | 42.38 | |
| MACD (12,26,9): | -0.0600 | |
| Directional Movement: | -1.07 | |
| AROON (14): | -57.14 | |
| DEMA (21): | 13.67 | |
| Parabolic SAR (0,02-0,02-0,2): | 13.32 | |
| Elder Ray (13): | -0.22 | |
| Super Trend (3,10): | 14.22 | |
| Zig ZAG (10): | 13.43 | |
| VORTEX (21): | 0.8900 | |
| Stochastique (14,3,5): | 16.49 | |
| TEMA (21): | 13.52 | |
| Williams %R (14): | -85.35 | |
| Chande Momentum Oscillator (20): | -0.58 | |
| Repulse (5,40,3): | -1.7000 | |
| ROCnROLL: | 2 | |
| TRIX (15,9): | 0.0200 | |
| Courbe Coppock: | 7.47 |
| MA7: | 13.58 | |
| MA20: | 13.84 | |
| MA50: | 13.70 | |
| MA100: | 13.25 | |
| MAexp7: | 13.57 | |
| MAexp20: | 13.71 | |
| MAexp50: | 13.61 | |
| MAexp100: | 13.20 | |
| Price / MA7: | -1.18% | |
| Price / MA20: | -3.03% | |
| Price / MA50: | -2.04% | |
| Price / MA100: | +1.28% | |
| Price / MAexp7: | -1.11% | |
| Price / MAexp20: | -2.12% | |
| Price / MAexp50: | -1.40% | |
| Price / MAexp100: | +1.67% |
News
Don't forget to follow the news on HUNTINGTON BANCSHARES INC.. At the time of publication of this analysis, the latest news was as follows:
- Investor Network: Huntington Bancshares Incorporated to Host Earnings Call
-
 Huntington's Disease Linked To Dysfunctional Brain Structure
-
Huntington Bancshares
- Growblox Sciences Announces Patent Application for Treatments of Parkinson's Disease, Alzheimer's Disease, Huntington's Disease and Dementia
- InvestorsObserver releases covered-call reports for Alibaba, ConocoPhillips, Facebook, Huntington Ingalls Industries and Suncor Energy
About author
Online


Add a comment
Comments
0 comments on the analysis HUNTINGTON BANCSHARES INC. - Daily