Evaluation of Pilbara Antimony-Gold Potential Generates Positive Results
- 80
HIGHLIGHTS
- Novo has completed a review of the antimony (Sb) – gold (Au) potential across its Pilbara ground holding, in light of recent global strategic metals supply changes.
- Two prospects in the early stages of exploration rank highly for antimony potential, including the historic Sherlock Crossing (Clarke) antimony mine and the Southeast Wyloo antimony-gold stream sediment anomaly.
- The Sherlock Crossing antimony mine was discovered in 1906 and operated during 1907 to 19161. Novo conducted reconnaissance work, collected rock chip samples and undertook soil sampling at Sherlock Crossing in 2022 with peak results of 1.71 g/t Au and 592 ppm Sb.
- Southeast Wyloo includes two, 2km-strike high-order Sb (± Au) stream sediment anomalies, where reconnaissance rock chip sampling completed by Novo in mid-2023 yielded peak results of 387 g/t Ag, 5.0% Pb, 1.6% Zn, 2.4% Cu, 0.38% Sb, and 0.52 g/t Au.
- Both projects represent exciting targets and will require detailed follow-up exploration work.
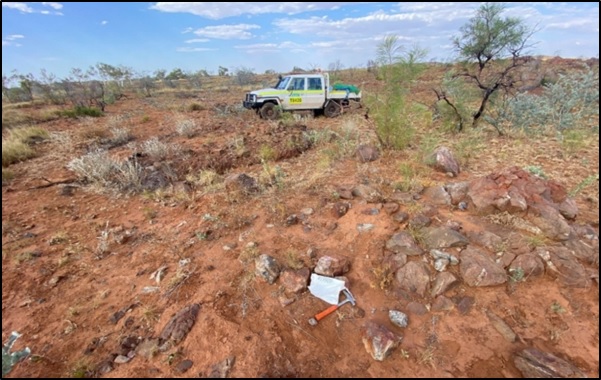
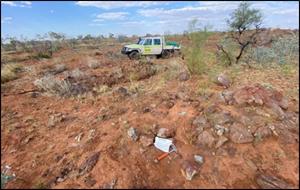
Figure 1: Novo’s rock chip sample W19909 at Sherlock Crossing, showing the subcrop in the area covered with flood plain sediments. Results include 1.71 g/t Au and 592 ppm Sb.
1. Maitland, A. Gibb, (1919) Antimony deposits in Western Australia, Geological Survey of Western Australia, State Government of Western Australia.
VANCOUVER, British Columbia, Sept. 11, 2024 (GLOBE NEWSWIRE) -- Novo Resources Corp. (Novo or the Company) (ASX: NVO) (TSX: NVO) (OTCQX: NSRPF) is pleased announce the results from a review of extensive geochemical and geological datasets across its West and Central Pilbara land holding targeting antimony (Sb) – gold (Au) potential.
The importance of antimony has increased significantly since China announced export restrictions in August. These restrictions are set to commence in mid-September. The price of antimony has nearly doubled since the start of 2024 and has hit record highs, with the critical metal predominantly used in flame retardant products, solar panels, lead-acid batteries and in the defence industry. China accounted for 48% of global antimony mine production in 2023.
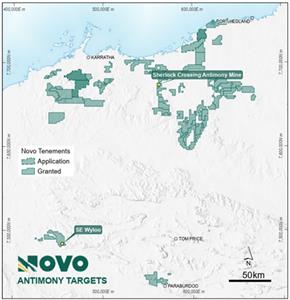
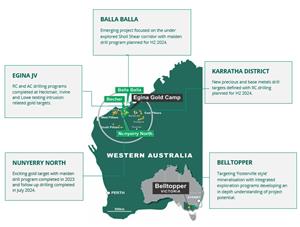
Importantly, through the assessment of the Company’s large Pilbara landholding, Novo has identified two prospects: the historic Sherlock Crossing (Clarke) antimony mine; and the Southeast Wyloo (SE Wyloo) Prospect (Figure 2), with significant Sb, Ag, Au, Cu, Pb and Zn potential. These prospects are located on tenements which are 100% owned by Novo subsidiaries and are in the early stages of exploration.
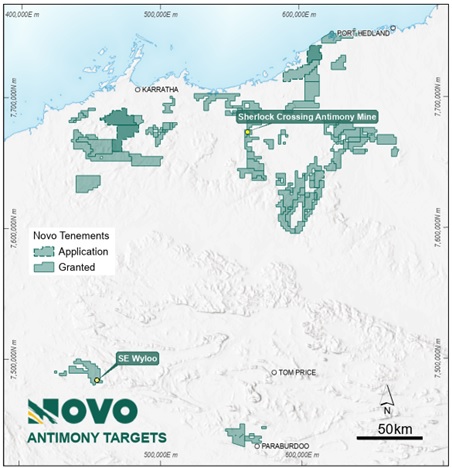
Figure 2: Location map of the Sherlock Crossing antimony mine and SE Wyloo targets.
Sherlock Crossing (Clarke) Antimony Mine
The Sherlock Crossing (Clarke) antimony mine (Figure 2) is a historic antimony-gold mine discovered in 1906 and operated during 1907 to 1916.
According to historic records, the mine initially produced 16 tonnes of dressed concentrate grading 53% Sb and 10.9 g/t Au to 72.9 g/t Au and in 1916, a further 5.66 tonnes of dressed concentrate grading 42.2% Sb and 15.6 g/t Au1.
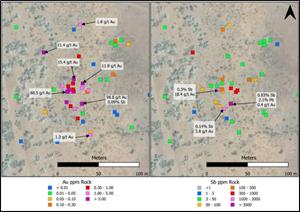
The workings are now largely covered by flood transported sands and clay on the eastern flood plain of the Sherlock River (Figure 1). Mineralisation was traced over 1,207 m strike and tested by a series of shafts up to 12 m deep, pits and trenches2. There is little evidence of the old workings, apart from three prospecting pits which have been filled with flood debris to within 2 metres of the surface. Rock chip sampling from this area has yielded peak results of 98.8 g/t Au and 0.83% Sb3 (Figure 4).
Three phases of minor evaluation work have been completed in the past and the project has not been drill tested. The text below in italics is extracted from the historical reports lodged by third parties:
- Aarex 19974 - As river sands from floods cover much of the area, geo-chemical sampling residual soils was not possible. It is apparent that the mineralisation described as being traced by a series of shallow shafts, pits and open cuts in historical literature occurs some distance to the west (further toward the river) of the few minor excavations still evident today. Thus, the most highly prospective area of the tenement was not sampled, as it would require either costeaning or drilling.
Thirty-five samples were taken from outcrop or from the dump surrounding the main historical excavation. The highest sample result was 84.8 g/t gold which averaged 68.5 g/t over four assays. Twenty samples returned values in excess of 0.1 g/t gold, with twelve returning values of between 1 g/t and 68.5 g/t gold over a zone of about 60 metres wide (not including the main Line of Lode). Although antimony was present in most of the samples, the highest value was only 180 ppm Sb, which is most unusual, given the area was known for antimony mining and very high grades and visible antimony ore. This further highlights the fact that the majority of the historical workings are covered by flood debris, to the west of the areas sampled.
- Ascent Mining 2002 (A66185) 3 - Sherlock Crossing, located at the site of the historical Clarke antimony mine, comprises gold antimony quartz veins in pillow basalt returning up to 98.8 g/t Au and 0.83% antimony from Ascent sampling programmes. Repeat sampling gave an average of 240.2 g/t Au (original sample plus three repeat assays). A total of 21 grab samples were collected from mine dumps and quartz veins/stringers in the vicinity of the exposed workings on the east bank of the Sherlock River. Of the 21 samples collected from this area 11 returned results in excess of 1g/t Au including 5 samples >10 g/t Au.
- Ourwest Corp 2007 (A76553) 5 – 11 samples gave peak results of 3.78 g/t Au and 1390 ppm Sb.
No assurance can be given that Novo will achieve similar results as part of its exploration activities at Sherlock Crossing.
Novo conducted reconnaissance work on the Sherlock Crossing antimony mine in 2022. Mapping of the remaining pits was conducted along with rock chip sampling, and soil sampling on the western side of the Sherlock River, in conjunction with stream sediment sampling. Seventeen rock chip samples were collected by Novo in the vicinity of the few remaining pits and to the north and west, with peak results of 1.71 g/t Au and 592 ppm Sb. Original high grade rock chip samples were not re-sampled at this time. See Appendix 1 for all results.
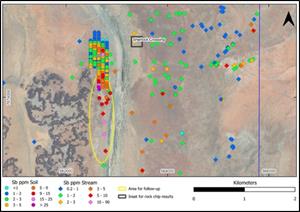
110 soil samples were completed at 80 m x 40 m spacings to cover an outcropping area on the western side of the Sherlock River. Peak soil results include 33.6 ppm Sb at the southern end of the grid and peak stream sediment results south of the soil grid yielded 13 ppm Sb (Figure 3). The 1.5 km long Sb anomaly requires follow-up work.
2 - Finucane, K. J., and Telford, R. J., 1939a, The antimony deposits of the Pilbara Goldfield: Aerial, Geological and Geophysical Survey of Northern Australia, Western Australia Report 47, 5p.
3 - A66185 Wamex Report - Ascent Mining Pty Ltd 2003 - Exploration Licence E47/760 Annual Technical and Progress Report for the Period 01 December 2001 to 30 November 2002
4 - A49869 A53516 Wamex Report - Aarex 1997 Annual Report Exploration Licence 47/760 Sherlock Crossing 1 December 1996 to 30 November 1997
5 - A76553 Wamex Report - Ourwest Corp 2007 - Liberty - Indee Project Combined Reporting Number: C130/2007 Annual Report EL 47/760 & EL 47/1209 In the name of Ourwest Corporation Pty Lid For The Period 27/09/2006 — 26/09/2007
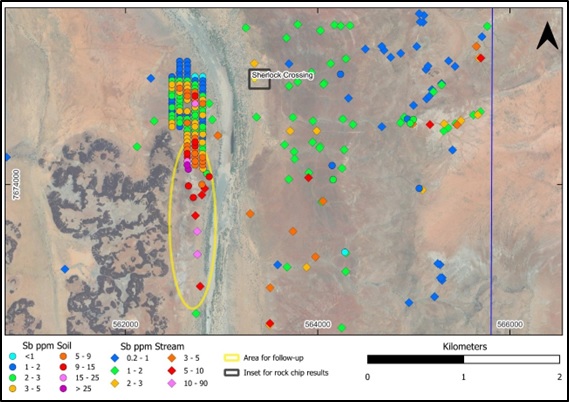
Figure 3 – Sherlock Crossing regional geochemistry highlighting strong antimony at the southern end of the soil grid, and significant antimony anomalism in stream sediment samples over 1.5 km to the south (yellow highlight).
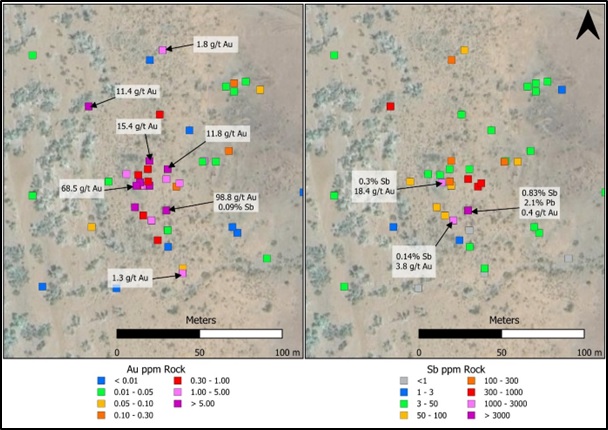
Figure 4 – All rock chip results including historical sampling3,4,5 from Sherlock Crossing antimony mine, highlighting gold (left) and antimony (right). In some cases, multiple samples were collected from the same point (mullock dump).
Novo’s rock chip and soil sampling results at Sherlock Crossing were collected prior to its listing on ASX in September 2023 and are reported to ASX in accordance with the JORC Code 2012 for the first time.
SE Wyloo Target
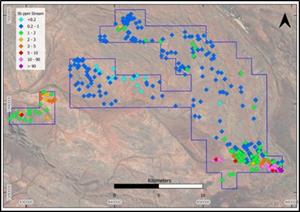
Exploration on the Wyloo tenement E47/4213 highlighted two significant antimony anomalies in the SE part of the licence area (Figure 5).
Peak stream sediment values recorded by Novo included 131 ppm Sb, being the most anomalous antimony sample in Novo’s dataset of 8,744 stream sediment samples assayed for antimony in the West and South Pilbara. Both anomalies are approximately 2 km long and trend E-W. Reconnaissance follow-up exploration on the eastern-most antimony-gold stream sediment anomaly in 2023 identified a zone of quartz-sulphide veining, rich in base metals, antimony, silver and gold (Figure 6) in the Jeerinah Formation (Upper Fortescue Group).
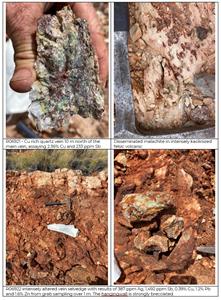
An ENE trending quartz vein swarm, outcropping over 150 m strike and in a zone up to 5 m thick, is present in a highly altered and partly brecciated felsic volcanic sequence of rocks. Strong kaolinite-sericite alteration occurs proximal to the vein swarm (>10 m) with minor disseminated copper (malachite) present (Figure 7).
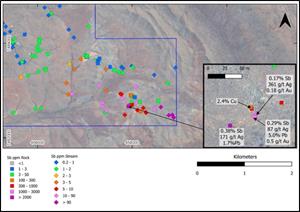
Samples generated results of 387 g/t Ag, 5.0% Pb, 1.6% Zn, 2.4% Cu, 0.38% Sb, and 0.52 g/t Au, from seven rock chips sampled (Table 1). Sample R06926 was collected over a 3 m width as a representation of the 3 m zone (not a true channel sample) and assayed 172 g/t Ag and 0.38% Sb. See Appendix 2 for a full list of results.
Table 1: Wyloo Project SE Sb anomaly - selected rock chip sample assay results 2023.
| Sample | Easting (m) | Northing (m) | Au g/t | Ag g/t | Cu% | Pb% | Sb% | Zn% |
| R06920 | 457954 | 7482688 | 0.002 | 2 | 1.08 | 0.02 | 0.03 | 0.25 |
| R06921 | 457953 | 7482690 | 0.005 | 7 | 2.36 | 0.02 | 0.02 | 0.12 |
| R06922 | 457962 | 7482681 | 0.142 | 387 | 0.39 | 1.17 | 0.15 | 1.6 |
| R06923 | 457960 | 7482678 | 0.188 | 361 | 0.05 | 0.58 | 0.17 | 0.03 |
| R06924 | 457958 | 7482676 | 0.518 | 88 | 0.05 | 5.00 | 0.29 | 0.17 |
| R06925 | 457998 | 7482697 | 0.005 | 67 | 0.14 | 1.20 | 0.06 | 0.03 |
| R06926 | 457922 | 7482663 | 0.006 | 172 | 0.02 | 1.69 | 0.38 | 0.1 |
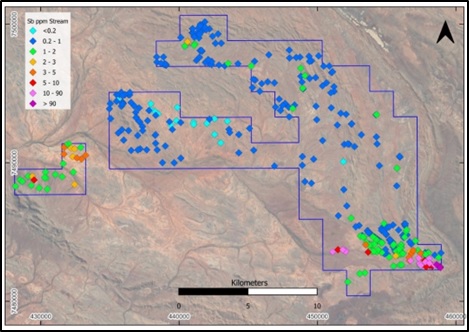
Figure 5: Wyloo Project in the South Pilbara showing the extensive high-order antimony stream sediment anomalies in the SE corner of the Tenement. Black box = inset Figure 6.
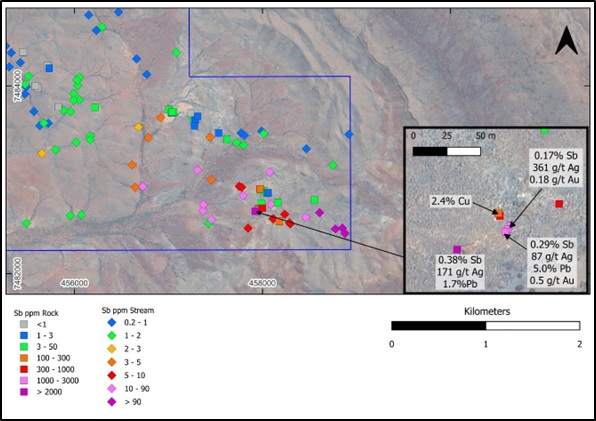
Figure 6: The SE antimony anomaly highlighting the stream sediment anomaly over 2 km strike and peak rock chip results, highlighting strong base-metal silver and gold mineralisation.
The mineralisation trends under colluvial and alluvial cover to the west southwest and east northeast. Much of the stream anomaly has not been assessed and the western antimony stream sediment anomaly remains completely untested. Reconnaissance exploration has provided very encouraging results.
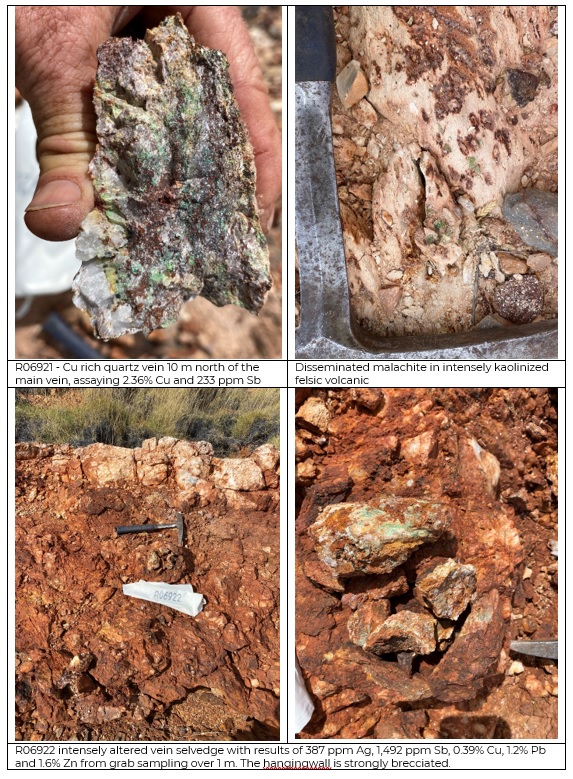
Figure 7 – Select reconnaissance rock chip samples from the SE Wyloo prospect
Novo’s rock chip sample results at SE Wyloo were collected prior to its listing on ASX in September 2023 and are now reported to ASX in accordance with the JORC Code 2012 for the first time.
Future Work
The historic Sherlock Crossing (Clarke) antimony mine area requires follow-up sampling and validation of previous high grade rock chips, heritage, drilling in the vicinity of the main workings and follow-up soil sampling, mapping and rock chip sampling in the area of the western stream anomaly.
Wyloo SE requires heritage, systematic soil sampling, detailed rock chip and channel sampling and mapping prior to RC drilling through the primary targets on the eastern anomaly, and follow-up stream sediment and soil sampling on the western target.
ANALYTIC METHODOLOGY
Aarex4 1997 – utilized fire assay with 50 g charge for Au analysis and single acid digest As, Ag, Cu, Ni, Pb, Sb and Zn assayed with ICP scan AAS finish at Minlab, Malaga Perth.
Ascent3 2002 - All samples were submitted to Ultratrace Laboratory in Canning Vale Perth and analysed for Au/Pt/Pd (via Fire Assay — Optical Emission Spectrometry [ICP-OES]) and Ag/As/Cu/Pb/Zn (via Multi-Acid digest — Mass Spectrometry [ICP-MS]).
Ourwest Corp5 2007 - All samples were submitted to Ultratrace Laboratory in Canningvale Perth and analysed for Au/Pt/Pd (via Fire Assay — Optical Emission Spectrometry [ICP-OES]) and multielements (via Multi-Acid digest — Mass Spectrometry (ICP-OES and Ag, Mo, As, SB by ICP-MS).
Historic companies do not report duplicate samples or insertion of CRMs or blanks.
Novo rock chip samples of 1 – 3 kg were submitted to Intertek commercial Genalysis (“Intertek”) in Perth, Western Australia where they were dried and crushed to -3 mm and pulverized to 75 µm or better (prep code SP64), with a > 85% pass, then assayed for Au by 50 g charge fire assay FA50/OE and for 48 elements using four acid digest – MS finish (4A/MS). Elements that reported above the upper detection limit for 4A/MS were reanalysed using method 4AH/OE. A minimum of 2 CRM standards relevant for the style of mineralisation and 2 blanks were submitted per 100 samples.
Soil samples were sieved to < 80 mesh and submitted to Intertek for aqua regia to analyse for 33 elements. A minimum of 2 CRM standards, 2 blanks and 4 field duplicates were submitted per 100 samples.
Stream sediment samples were sieved to < 0.9 mm and submitted to Intertek where they were dried and pulverized to 75 µm or better (prep code SP02), with a > 85% pass, then analysed for aqua regia for 33 elements. In addition, the samples are analysed via BLEG (Bulk Leach Extractable Gold) 500 g cyanide leach with MS finish for Au, Pt, Pd and Ag.
Historical exploration results contained in the WAMEX Reports lodged by the other companies referred to in this news release have not been reported in accordance with the JORC Code 2012 or NI 43-101 and a Competent Person/Qualified Person has not done sufficient work to disclose the exploration results in accordance with the JORC Code 2012 or NI 43-101. It is possible that following further evaluation and/or exploration work that the confidence in the prior reported exploration results may be reduced when reported under the JORC Code 2012 or NI 43-101. Novo confirms that nothing has come to its attention that causes it to question the accuracy or reliability of the results included in the WAMEX Reports, but Novo has not independently validated those results and therefore is not to be regarded as reporting, adopting or endorsing those results. No assurance can be given that Novo will achieve similar results as part of its exploration activities at its Pilbara projects.
Authorised for release on behalf of the Board of Directors.
CONTACT
| Investors: Mike Spreadborough +61 8 6400 6100 [email protected] | North American Queries: Leo Karabelas +1 416 543 3120 [email protected] | Media: Cameron Gilenko +61 466 984 953 [email protected] |
QP STATEMENT
Mrs. Karen (Kas) De Luca (MAIG), is the qualified person, as defined under NI 43-101 Standards of Disclosure for Mineral Projects, responsible for, and having reviewed and approved, the technical information contained in this news release. Mrs De Luca is Novo’s General Manager Exploration.
JORC COMPLIANCE STATEMENT
The information in this news release that relates to exploration results in the Pilbara is based on information compiled by Mrs De Luca, who is a full-time employee of Novo Resources Corp. Mrs De Luca is a Competent Person who is a member of the Australian Institute of Geoscientists. Mrs De Luca has sufficient experience that is relevant to the style of mineralisation and the type of deposits under consideration and to the activity being undertaken to qualify as a Competent Person as defined in the 2012 Edition of the 'Australasian Code for Reporting of Exploration Results, Mineral Resources and Ore Reserves'. Mrs De Luca consents to the inclusion in the report of the matters based on her information in the form and context in which it appears.
FORWARD-LOOKING STATEMENTS
Some statements in this news release may contain “forward-looking statements” within the meaning of Canadian and Australian securities law and regulations. In this news release, such statements include but are not limited to planned exploration activities and the timing of such. These statements address future events and conditions and, as such, involve known and unknown risks, uncertainties and other factors which may cause the actual results, performance or achievements to be materially different from any future results, performance or achievements expressed or implied by the statements. Such factors include, without limitation, customary risks of the resource industry and the risk factors identified in Novo’s annual information form for the year ended December 31, 2023 (which is available under Novo’s profile on SEDAR+ at www.sedarplus.ca and at www.asx.com.au) in the Company’s prospectus dated 2 August 2023 which is available at www.asx.com.au. Forward-looking statements speak only as of the date those statements are made. Except as required by applicable law, Novo assumes no obligation to update or to publicly announce the results of any change to any forward-looking statement contained or incorporated by reference herein to reflect actual results, future events or developments, changes in assumptions or changes in other factors affecting the forward-looking statements. If Novo updates any forward-looking statement(s), no inference should be drawn that the Company will make additional updates with respect to those or other forward-looking statements.
ABOUT NOVO
Novo is an Australian based gold explorer listed on the ASX and the TSX focused on discovering standalone gold projects with > 1 Moz development potential. Novo is an innovative gold explorer with a significant land package covering approximately 6,700 square kilometres in the Pilbara region of Western Australia, along with the 22 square kilometre Belltopper project in the Bendigo Tectonic Zone of Victoria, Australia.
Novo’s key project area is the Egina Gold Camp, where De Grey Mining is farming-in to form a JV at the Becher Project and surrounding tenements through exploration expenditure of A$25 million within 4 years for a 50% interest. The Becher Project has similar geological characteristics as De Grey’s 12.7 Moz Hemi Project6. Novo is also advancing gold exploration at Nunyerry North, part of the Croydon JV (Novo 70%: Creasy Group 30%), where 2023 exploration drilling identified significant gold mineralisation. Novo continues to undertake early-stage exploration across its Pilbara tenement portfolio.
Novo has also formed lithium joint ventures with both Liatam and SQM in the Pilbara which provides shareholder exposure to battery metals.
Novo has a significant investment portfolio and a disciplined program in place to identify value accretive opportunities that will build further value for shareholders.
Please refer to Novo’s website for further information including the latest Corporate Presentation.
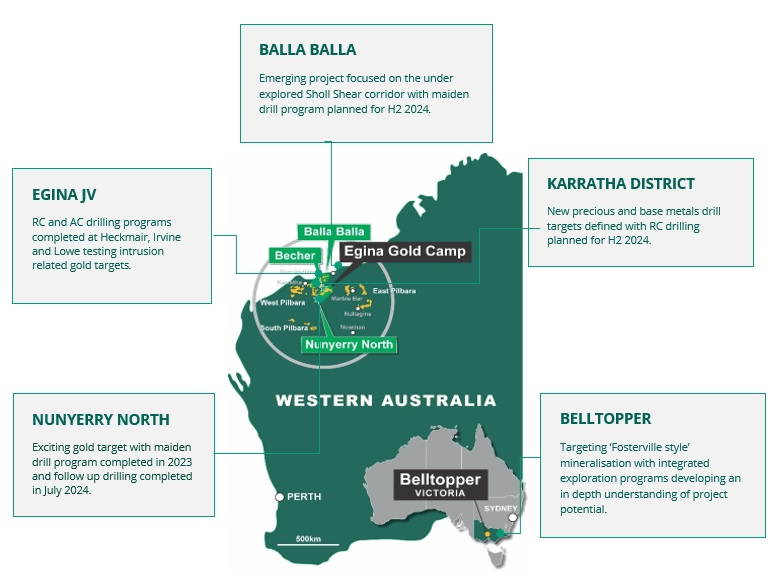
6. Refer to De Grey ASX Announcement, Hemi Gold Project Resource Update, dated 21 November 2023. No assurance can be given that a similar {or any) commercially mineable deposit will be determined at Novo’s Becher project.
Appendix 1 – Rock Chip Table of Results Clarke Sb Mine and Surrounds (all samples)
| Sample | Company | Coord sys | East (m) | North (m) | Au g/t | Sb ppm | Cu ppm | Pb ppm |
| 5301 | Aarex4 | AMG84_50 | 563207 | 7674855 | 0.01 | 0.4 | 27 | 9 |
| 5302 | Aarex4 | AMG84_50 | 563247 | 7674864 | 1.26 | 0 | 38 | 5 |
| 5303 | Aarex4 | AMG84_50 | 563298 | 7674873 | 0.02 | 0 | 31 | 10 |
| 5304 | Aarex4 | AMG84_50 | 563362 | 7674842 | 0.02 | 0.4 | 17 | 1 |
| 5305 | Aarex4 | AMG84_50 | 563238 | 7674890 | 0.02 | 1 | 23 | 3 |
| 5306 | Aarex4 | AMG84_50 | 563232 | 7674884 | 0.51 | 2.6 | 48 | 5 |
| 5307 | Aarex4 | AMG84_50 | 563192 | 7674892 | 0.1 | 1.6 | 37 | 7 |
| 5308 | Aarex4 | AMG84_50 | 563227 | 7674917 | 25.9 | 40 | 190 | 1200 |
| 5309 | Aarex4 | AMG84_50 | 563227 | 7674917 | 3.47 | 16 | 66 | 240 |
| 5310 | Aarex4 | AMG84_50 | 563227 | 7674917 | 0.09 | 7.4 | 61 | 22 |
| 5311 | Aarex4 | AMG84_50 | 563227 | 7674917 | 3.01 | 17 | 88 | 62 |
| 5312 | Aarex4 | AMG84_50 | 563227 | 7674917 | 0.17 | 3.2 | 57 | 22 |
| 5313 | Aarex4 | AMG84_50 | 563227 | 7674917 | 0.05 | 9.2 | 74 | 77 |
| 5314 | Aarex4 | AMG84_50 | 563227 | 7674917 | 0.12 | 5.8 | 120 | 150 |
| 5315 | Aarex4 | AMG84_50 | 563227 | 7674917 | 0.33 | 22 | 92 | 53 |
| 5316 | Aarex4 | AMG84_50 | 563227 | 7674917 | 68.5 | 53 | 730 | 9800 |
| 5317 | Aarex4 | AMG84_50 | 563213 | 7674924 | 4.15 | 43 | 150 | 1400 |
| 5318 | Aarex4 | AMG84_50 | 563227 | 7674932 | 15.4 | 180 | 28 | 800 |
| 5319 | Aarex4 | AMG84_50 | 563226 | 7674927 | 0.98 | 25 | 42 | 90 |
| 5320 | Aarex4 | AMG84_50 | 563238 | 7674927 | 11.8 | 13 | 98 | 5700 |
| 5321 | Aarex4 | AMG84_50 | 563260 | 7674932 | 3.12 | 15 | 110 | 760 |
| 5322 | Aarex4 | AMG84_50 | 563275 | 7674938 | 0.25 | 6.8 | 37 | 49 |
| 5323 | Aarex4 | AMG84_50 | 563294 | 7674975 | 0.06 | 1.2 | 32 | 18 |
| 5324 | Aarex4 | AMG84_50 | 563235 | 7674999 | 1.83 | 63 | 13 | 14 |
| 5325 | Aarex4 | AMG84_50 | 563131 | 7675167 | 0.33 | 25 | 43 | 16 |
| 5326 | Aarex4 | AMG84_50 | 563175 | 7675148 | 0.04 | 3.2 | 68 | 9 |
| 5327 | Aarex4 | AMG84_50 | 563198 | 7675170 | 0.03 | 2 | 53 | 4 |
| 5328 | Aarex4 | AMG84_50 | 563111 | 7675208 | 0.02 | 0.8 | 27 | 5 |
| 5329 | Aarex4 | AMG84_50 | 563130 | 7675251 | 0.02 | 1.6 | 58 | 8 |
| 5330 | Aarex4 | AMG84_50 | 563130 | 7675251 | 0.04 | 0 | 12 | 5 |
| AX00021 | Ascent Mining3 | MGA94_50 | 563375 | 7675056 | 0.421 | 8300 | 200 | 21000 |
| AX00022 | Ascent Mining3 | MGA94_50 | 563375 | 7675056 | 5.14 | 462 | 165 | 545 |
| AX00023 | Ascent Mining3 | MGA94_50 | 563375 | 7675056 | 98.8 | 926 | 480 | 2050 |
| AX00024 | Ascent Mining3 | MGA94_50 | 563375 | 7675056 | 71.7 | 1140 | 250 | 1280 |
| AX00025 | Ascent Mining3 | MGA94_50 | 563375 | 7675056 | 90.6 | 356 | 420 | 920 |
| AX00026 | Ascent Mining3 | MGA94_50 | 563359 | 7675073 | 3.07 | 269 | 70 | 440 |
| AX00027 | Ascent Mining3 | MGA94_50 | 563359 | 7675073 | 18.4 | 2960 | 110 | 345 |
| AX00028 | Ascent Mining3 | MGA94_50 | 563361 | 7675053 | 0.423 | 59.4 | 30 | 125 |
| AX00029 | Ascent Mining3 | MGA94_50 | 563371 | 7675114 | 0.653 | 11.6 | 15 | 15 |
| AX00030 | Ascent Mining3 | MGA94_50 | 563328 | 7675119 | 0.035 | 7 | 540 | 10 |
| AX00031 | Ascent Mining3 | MGA94_50 | 563328 | 7675119 | 0.039 | 8.4 | 115 | 5 |
| AX00032 | Ascent Mining3 | MGA94_50 | 563328 | 7675119 | 11.4 | 628 | 1550 | 100 |
| AX00033 | Ascent Mining3 | MGA94_50 | 563328 | 7675119 | 0.012 | 10.8 | 35 | 5 |
| AX00034 | Ascent Mining3 | MGA94_50 | 563385 | 7675021 | 0.068 | 11.2 | 70 | 5 |
| AX00035 | Ascent Mining3 | MGA94_50 | 563376 | 7675034 | 0.005 | 12.4 | 25 | 5 |
| AX00036 | Ascent Mining3 | MGA94_50 | 563356 | 7675058 | 3.77 | 59 | 135 | 5 |
| AX00037 | Ascent Mining3 | MGA94_50 | 563356 | 7675058 | 7.52 | 78.8 | 85 | 10 |
| AX00038 | Ascent Mining3 | MGA94_50 | 563375 | 7675075 | 0.526 | 783 | 85 | 2820 |
| AX00039 | Ascent Mining3 | MGA94_50 | 563375 | 7675075 | 2.85 | 355 | 45 | 950 |
| AX00040 | Ascent Mining3 | MGA94_50 | 563416 | 7675128 | 0.017 | 19.4 | 20 | -0.5 |
| AX00041 | Ascent Mining3 | MGA94_50 | 563416 | 7675128 | 0.027 | 18.6 | 20 | 5 |
| J2401 | Ourwest Corp5 | MGA94_50 | 563366 | 7675050 | 3.78 | 1390 | 110 | 2100 |
| J2402 | Ourwest Corp5 | MGA94_50 | 563366 | 7675050 | 0.017 | 60.6 | 40 | -100 |
| J2403 | Ourwest Corp5 | MGA94_50 | 563366 | 7675050 | 0.258 | 100 | 55 | -100 |
| J5101 | Ourwest Corp5 | MGA94_50 | 563294 | 7675150 | 0.012 | 8 | 40 | 5 |
| J5111 | Ourwest Corp5 | MGA94_50 | 563481 | 7675117 | 0.012 | 13.2 | 10 | 11 |
| J5121 | Ourwest Corp5 | MGA94_50 | 563481 | 7675117 | 0.008 | 12.2 | 20 | 7 |
| J5131 | Ourwest Corp5 | MGA94_50 | 563300 | 7675010 | 0.004 | 10.8 | 70 | 8 |
| J5601 | Ourwest Corp5 | MGA94_50 | 563294 | 7675065 | -0.002 | 7.2 | 30 | 4 |
| J5701 | Ourwest Corp5 | MGA94_50 | 563294 | 7675065 | 0.008 | 49.4 | 20 | 24 |
| J5801 | Ourwest Corp5 | MGA94_50 | 563294 | 7675065 | 0.01 | 23.2 | 65 | 12 |
| J5901 | Ourwest Corp5 | MGA94_50 | 563294 | 7675065 | 0.048 | 6.8 | 90 | 10 |
| W10757 | Novo | MGA2020_50 | 563366 | 7675148.5 | 0.01 | 269.25 | 26.4 | 2.1 |
| W10758 | Novo | MGA2020_50 | 563412 | 7675132.5 | 0.021 | 23.93 | 36.6 | 1 |
| W10759 | Novo | MGA2020_50 | 563417 | 7675134.5 | 0.241 | 20.61 | 27.5 | 0.9 |
| W10761 | Novo | MGA2020_50 | 563424 | 7675135.5 | 0.017 | 26.18 | 28.6 | 2.5 |
| W10762 | Novo | MGA2020_50 | 563459 | 7675068.5 | 0.008 | 9.24 | 6.3 | 2.8 |
| W10763 | Novo | MGA2020_50 | 563485 | 7675054.5 | 0.008 | 15.78 | 34.7 | 1.4 |
| W19905 | Novo | MGA2020_50 | 563421 | 7675204 | 0.077 | 35.65 | 90.3 | 9.8 |
| W19906 | Novo | MGA2020_50 | 563359 | 7675079 | 0.323 | 47.61 | 29.9 | 80.3 |
| W19912 | Novo | MGA2020_50 | 563398 | 7675087 | 0.035 | 119.38 | 27.2 | 6.9 |
| W19913 | Novo | MGA2020_50 | 563341 | 7675075 | 0.045 | 65.65 | 18.7 | 3.8 |
| W19914 | Novo | MGA2020_50 | 563419 | 7675044 | 0.003 | 10.59 | 148.5 | 9.3 |
| W10764 | Novo | MGA2020_50 | 563416 | 7675047.5 | 0.004 | 7.44 | 41 | 8.9 |
| W19907 | Novo | MGA2020_50 | 563365 | 7675075 | 0.415 | 132.27 | 31.4 | 9 |
| W19908 | Novo | MGA2020_50 | 563382 | 7675072 | 0.143 | 442.41 | 41.9 | 715.3 |
| W19909 | Novo | MGA2020_50 | 563384 | 7675074 | 1.708 | 592.16 | 219 | 2556.7 |
| W19910 | Novo | MGA2020_50 | 563390 | 7675106 | 0.003 | 4.42 | 7.3 | 11.3 |
| W19911 | Novo | MGA2020_50 | 563406 | 7675087 | 0.038 | 80.06 | 27.5 | 29.6 |
Appendix 2 – Rock Chip Table of Results Wyloo SE Anomaly and Surrounds (all samples) – co-ordinate system is MGA2020_50 for all samples
| Sample | East (m) | North (m) | Au g/t | Ag g/t | Cu ppm | Pb ppm | Sb ppm | Zn ppm |
| R06927 | 458554 | 7482785 | 0.00 | 0.6 | 10 | 56 | 32.01 | 81 |
| R06926 | 457922 | 7482663 | 0.01 | 171.8 | 240 | 16859 | 3786 | 967 |
| R06925 | 457998 | 7482697 | 0.01 | 66.8 | 1361 | 11995 | 630.1 | 312 |
| R06924 | 457958 | 7482676 | 0.52 | 87.8 | 497 | 50027 | 2908 | 1654 |
| R06923 | 457960 | 7482678 | 0.19 | 361.0 | 541 | 5814 | 1698 | 348 |
| R06922 | 457962 | 7482681 | 0.14 | 386.9 | 3854 | 11714 | 1492 | 16042 |
| R06921 | 457953 | 7482690 | 0.01 | 7.2 | 23590 | 188 | 233 | 1178 |
| R06920 | 457954 | 7482688 | 0.00 | 1.7 | 10815 | 182 | 343.9 | 2525 |
| R06919 | 457987 | 7482752 | 0.00 | 0.1 | 20 | 39 | 6.74 | 1217 |
| R06917 | 457974 | 7482902 | 0.01 | 1.9 | 368 | 798 | 150.7 | 470 |
| R06916 | 458009 | 7482882 | 0.00 | 0.5 | 213 | 21 | 18.92 | 732 |
| R06915 | 458060 | 7482860 | 0.00 | 0.1 | 9 | 5 | 2.08 | 22 |
| R06914 | 458051 | 7482860 | 0.01 | 0.5 | 15 | 323 | 6.34 | 27 |
| R06913 | 458162 | 7482756 | 0.00 | 1.6 | 129 | 604 | 18.26 | 419 |
| R06912 | 458180 | 7482557 | 0.00 | 0.1 | 8 | 9 | 187.1 | 19 |
JORC Code, 2012 Edition – Table 1
Section 1: Sampling Techniques and Data
(Criteria listed in the preceding section also apply to this section)
| Criteria | JORC Code explanation | Commentary |
| Sampling techniques |
|
|
| Drilling techniques |
|
|
| Drill sample recovery |
|
|
| Logging |
|
|
| Sub-sampling techniques and sample preparation |
|
|
| Quality of assay data and laboratory tests |
|
|
| Verification of sampling and assaying |
|
|
| Location of data points |
|
|
| Data spacing and distribution |
|
|
| Orientation of data in relation to geological structure |
|
|
| Sample security |
|
|
| Audits or reviews |
|
|
Section 2: Reporting of Exploration Results
(Criteria listed in the preceding section also apply to this section)
| Criteria | JORC Code explanation | Commentary |
| Mineral tenement and land tenure status |
|
|
| Exploration done by other parties |
|
|
| Geology |
|
|
| Drill hole Information |
|
|
| Data aggregation methods |
|
|
| Relationship between mineralisation widths and intercept lengths |
|
|
| Diagrams |
|
|
| Balanced reporting |
|
|
| Other substantive exploration data |
|
|
| Further work |
|
|
No Section 3 or 4 report as no Mineral Resources or Ore Reserves are reported in this Appendix
Photos accompanying this announcement are available at:
https://www.globenewswire.com/NewsRoom/AttachmentNg/bbd270ac-218f-4c85-9da7-7ccbc15998b6
https://www.globenewswire.com/NewsRoom/AttachmentNg/2a72ba16-f742-474e-99ab-07d58c9ba964
https://www.globenewswire.com/NewsRoom/AttachmentNg/1eb1d86e-0ad1-448c-8699-3096ab6a272c
https://www.globenewswire.com/NewsRoom/AttachmentNg/7c8576fe-b931-4a95-a726-8f125c9c047d
https://www.globenewswire.com/NewsRoom/AttachmentNg/f0b200ad-e046-48dd-847d-271e5e25b0cc
https://www.globenewswire.com/NewsRoom/AttachmentNg/227e2930-a106-4d48-98f6-df440bd27ee2
https://www.globenewswire.com/NewsRoom/AttachmentNg/b695872a-fed9-4bec-9c7b-b932d6e8e445
https://www.globenewswire.com/NewsRoom/AttachmentNg/440162f7-f9c3-4428-86dc-827b7d6227be

Figure 1: Novo’s rock chip sample W19909 at Sherlock Crossing, showing the subcrop in the area covered with flood plain sediments. Results include 1.71 g/t Au and 592 ppm Sb.
Figure 1: Novo’s rock chip sample W19909 at Sherlock Crossing, showing the subcrop in the area covered with flood plain sediments. Results include 1.71 g/t Au and 592 ppm Sb.
Figure 2: Location map of the Sherlock Crossing antimony mine and SE Wyloo targets.
Figure 2: Location map of the Sherlock Crossing antimony mine and SE Wyloo targets.
Figure 3 – Sherlock Crossing regional geochemistry highlighting strong antimony at the southern end of the soil grid, and significant antimony anomalism in stream sediment samples over 1.5 km to the south (yellow highlight).
Figure 3 – Sherlock Crossing regional geochemistry highlighting strong antimony at the southern end of the soil grid, and significant antimony anomalism in stream sediment samples over 1.5 km to the south (yellow highlight).
Figure 4 – All rock chip results including historical sampling3,4,5 from Sherlock Crossing antimony mine, highlighting gold (left) and antimony (right). In some cases, multiple samples were collected from the same point (mullock dump).
Figure 4 – All rock chip results including historical sampling3,4,5 from Sherlock Crossing antimony mine, highlighting gold (left) and antimony (right). In some cases, multiple samples were collected from the same point (mullock dump).
Figure 5: Wyloo Project in the South Pilbara showing the extensive high-order antimony stream sediment anomalies in the SE corner of the Tenement. Black box = inset Figure 6.
Figure 5: Wyloo Project in the South Pilbara showing the extensive high-order antimony stream sediment anomalies in the SE corner of the Tenement. Black box = inset Figure 6.
Figure 6: The SE antimony anomaly highlighting the stream sediment anomaly over 2 km strike and peak rock chip results, highlighting strong base-metal silver and gold mineralisation.
Figure 6: The SE antimony anomaly highlighting the stream sediment anomaly over 2 km strike and peak rock chip results, highlighting strong base-metal silver and gold mineralisation.
Figure 7 – Select reconnaissance rock chip samples from the SE Wyloo prospect
Figure 7 – Select reconnaissance rock chip samples from the SE Wyloo prospect
Figure 8
Figure 8
GlobeNewswire is one of the world's largest newswire distribution networks, specializing in the delivery of corporate press releases, financial disclosures and multimedia content to media, investors, and consumers worldwide.

