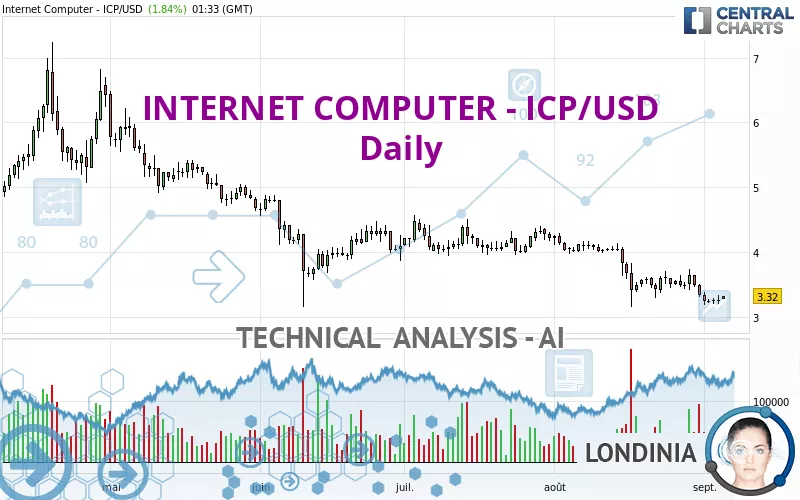
INTERNET COMPUTER - ICP/USD - Daily - Technical analysis published on 09/05/2023 (GMT)
- 141
- 0
- Who voted?
Click here for a new analysis!
- Timeframe : Daily
- - Analysis generated on
- Status : TARGET REACHED

Summary of the analysis

Additional analysis
Quotes
INTERNET COMPUTER - ICP/USD rating 3.32 USD. On the day, this instrument gained +1.84% and was between 3.27 USD and 3.32 USD. This implies that the price is at +1.53% from its lowest and at 0% from its highest.A bullish opening was detected by the Central Gaps scanner. Buyers are trying to impose a bullish momentum in the very short term.
Bullish opening
Type : Bullish
Timeframe : Openning
A study of price movements over other periods shows the following variations:
Near a new LOW record (5 years)
Type : Bearish
Timeframe : Weekly
Near a new LOW record (1 year)
Type : Bearish
Timeframe : Weekly
Near a new LOW record (1st january)
Type : Bearish
Timeframe : Weekly
Near a new LOW record (1 month)
Type : Bearish
Timeframe : Weekly
Technical
Technical analysis of this Daily chart of INTERNET COMPUTER - ICP/USD indicates that the overall trend is strongly bearish. 92.86% of the signals given by moving averages are bearish. This strongly bearish trend is supported by the strong bearish signals given by short-term moving averages. The Central Indicators scanner does not detect any result on moving averages that would impact this trend.
In fact, according to the parameters integrated into the Central Analyzer system, only 9 technical indicators out of 18 analysed are currently bearish. Caution: the Central Indicators scanner currently detects an excess:
CCI indicator is oversold : under -100
Type : Neutral
Timeframe : Daily
MACD indicator: bullish divergence
Type : Bullish
Timeframe : Daily
Williams %R indicator is oversold : under -80
Type : Neutral
Timeframe : Daily
The analysis of the price chart with Central Patterns scanners does not return any result.
The Central Candlesticks scanner, specialised in Japanese candlesticks, did not identify any signals.
| Price | R1 | R2 | R3 | |
|---|---|---|---|---|
| ProTrendLines | 3.32 | 3.86 | 4.75 | 5.23 |
| Change (%) | - | +16.27% | +43.07% | +57.53% |
| Change | - | +0.54 | +1.43 | +1.91 |
| Level | - | Major | Intermediate | Minor |
Attention could also be paid to pivot points to set price objectives:
| Pivot points | S3 | S2 | S1 | PP | R1 | R2 | R3 |
|---|---|---|---|---|---|---|---|
| Standard | 3.04 | 3.11 | 3.19 | 3.26 | 3.34 | 3.41 | 3.49 |
| Camarilla | 3.22 | 3.23 | 3.25 | 3.26 | 3.27 | 3.29 | 3.30 |
| Woodie | 3.04 | 3.11 | 3.19 | 3.26 | 3.34 | 3.41 | 3.49 |
| Fibonacci | 3.11 | 3.17 | 3.21 | 3.26 | 3.32 | 3.36 | 3.41 |
| Pivot points | S3 | S2 | S1 | PP | R1 | R2 | R3 |
|---|---|---|---|---|---|---|---|
| Standard | 2.48 | 2.83 | 3.04 | 3.39 | 3.60 | 3.95 | 4.16 |
| Camarilla | 3.10 | 3.15 | 3.20 | 3.25 | 3.30 | 3.35 | 3.40 |
| Woodie | 2.41 | 2.80 | 2.97 | 3.36 | 3.53 | 3.92 | 4.09 |
| Fibonacci | 2.83 | 3.04 | 3.18 | 3.39 | 3.60 | 3.74 | 3.95 |
| Pivot points | S3 | S2 | S1 | PP | R1 | R2 | R3 |
|---|---|---|---|---|---|---|---|
| Standard | 1.76 | 2.45 | 2.90 | 3.59 | 4.04 | 4.73 | 5.18 |
| Camarilla | 3.03 | 3.13 | 3.24 | 3.34 | 3.45 | 3.55 | 3.65 |
| Woodie | 1.63 | 2.39 | 2.77 | 3.53 | 3.91 | 4.67 | 5.05 |
| Fibonacci | 2.45 | 2.89 | 3.16 | 3.59 | 4.03 | 4.30 | 4.73 |
Numerical data
The following is the status of the technical indicators and moving averages at the time of publication of this technical analysis:
| RSI (14): | 35.77 | |
| MACD (12,26,9): | -0.1600 | |
| Directional Movement: | -7.89 | |
| AROON (14): | -21.43 | |
| DEMA (21): | 3.27 | |
| Parabolic SAR (0,02-0,02-0,2): | 3.70 | |
| Elder Ray (13): | -0.12 | |
| Super Trend (3,10): | 3.75 | |
| Zig ZAG (10): | 3.30 | |
| VORTEX (21): | 0.9000 | |
| Stochastique (14,3,5): | 16.07 | |
| TEMA (21): | 3.22 | |
| Williams %R (14): | -80.36 | |
| Chande Momentum Oscillator (20): | -0.32 | |
| Repulse (5,40,3): | -0.7000 | |
| ROCnROLL: | 2 | |
| TRIX (15,9): | -0.6100 | |
| Courbe Coppock: | 12.72 |
| MA7: | 3.30 | |
| MA20: | 3.45 | |
| MA50: | 3.83 | |
| MA100: | 4.02 | |
| MAexp7: | 3.32 | |
| MAexp20: | 3.48 | |
| MAexp50: | 3.75 | |
| MAexp100: | 4.07 | |
| Price / MA7: | +0.61% | |
| Price / MA20: | -3.77% | |
| Price / MA50: | -13.32% | |
| Price / MA100: | -17.41% | |
| Price / MAexp7: | -0% | |
| Price / MAexp20: | -4.60% | |
| Price / MAexp50: | -11.47% | |
| Price / MAexp100: | -18.43% |
About author
Online


Add a comment
Comments
0 comments on the analysis INTERNET COMPUTER - ICP/USD - Daily