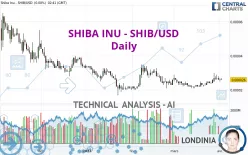
SHIBA INU - SHIB/USD - Daily - Technical analysis published on 04/02/2022 (GMT)
- 400
- 0
- Timeframe : Daily
- - Analysis generated on
- Status : NEUTRAL

Summary of the analysis

Additional analysis
Quotes
SHIBA INU - SHIB/USD rating 0.000026 USD. The price has increased by +0.00% since the last closing and was between 0.000026 USD and 0.000027 USD. This implies that the price is at 0% from its lowest and at -3.70% from its highest.A study of price movements over other periods shows the following variations:
Abnormal volumes
Timeframe : 5 days
Abnormal volumes
Timeframe : 20 days
Abnormal volumes
Timeframe : 50 days
Technical
Technical analysis of SHIBA INU - SHIB/USD in Daily shows a neutral overall trend. The slightly bullish signals currently given by short-term moving averages could allow the overall trend to return to a slightly bullish trend. The Central Indicators scanner detects a bullish signal on moving averages that could impact this trend:
Bullish price crossover with Moving Average 100
Type : Bullish
Timeframe : Daily
The technical indicators are bullish. There is still some doubt about the price increase.
Central Indicators, the detector scanner for these technical indicators has recently detected several signals:
Pivot points : price is over resistance 2
Type : Neutral
Timeframe : Daily
Pivot points : price is over resistance 2
Type : Neutral
Timeframe : Weekly
Ichimoku : price is over the cloud
Type : Bullish
Timeframe : Daily
No signals are given by Central Patterns, a market scanner specialised in chart patterns, resistances and supports.
No result was found by the Central Candlesticks scanner on Japanese candlesticks.
| S2 | S1 | Price | R1 | R2 | R3 | |
|---|---|---|---|---|---|---|
| ProTrendLines | 0.000007 | 0.000021 | 0.000026 | 0.000031 | 0.000047 | 0.000065 |
| Change (%) | -73.08% | -19.23% | - | +19.23% | +80.77% | +150.00% |
| Change | -0.000019 | -0.000005 | - | +0.000005 | +0.000021 | +0.000039 |
| Level | Minor | Major | - | Intermediate | Minor | Minor |
Attention could also be paid to pivot points to set price objectives:
| Pivot points | S3 | S2 | S1 | PP | R1 | R2 | R3 |
|---|---|---|---|---|---|---|---|
| Standard | 0.000024 | 0.000025 | 0.000025 | 0.000026 | 0.000026 | 0.000027 | 0.000027 |
| Camarilla | 0.000026 | 0.000026 | 0.000026 | 0.000026 | 0.000026 | 0.000026 | 0.000026 |
| Woodie | 0.000025 | 0.000025 | 0.000026 | 0.000026 | 0.000027 | 0.000027 | 0.000028 |
| Fibonacci | 0.000025 | 0.000025 | 0.000025 | 0.000026 | 0.000026 | 0.000026 | 0.000027 |
| Pivot points | S3 | S2 | S1 | PP | R1 | R2 | R3 |
|---|---|---|---|---|---|---|---|
| Standard | 0.000019 | 0.000021 | 0.000022 | 0.000024 | 0.000025 | 0.000027 | 0.000028 |
| Camarilla | 0.000023 | 0.000024 | 0.000024 | 0.000024 | 0.000024 | 0.000025 | 0.000025 |
| Woodie | 0.000020 | 0.000021 | 0.000023 | 0.000024 | 0.000026 | 0.000027 | 0.000029 |
| Fibonacci | 0.000021 | 0.000022 | 0.000023 | 0.000024 | 0.000025 | 0.000026 | 0.000027 |
| Pivot points | S3 | S2 | S1 | PP | R1 | R2 | R3 |
|---|---|---|---|---|---|---|---|
| Standard | 0.000012 | 0.000017 | 0.000021 | 0.000026 | 0.000030 | 0.000035 | 0.000039 |
| Camarilla | 0.000024 | 0.000024 | 0.000025 | 0.000026 | 0.000027 | 0.000028 | 0.000029 |
| Woodie | 0.000013 | 0.000017 | 0.000022 | 0.000026 | 0.000031 | 0.000035 | 0.000040 |
| Fibonacci | 0.000017 | 0.000020 | 0.000022 | 0.000026 | 0.000029 | 0.000031 | 0.000035 |
Numerical data
The following is the status of technical indicators and moving averages registered at the time this technical analysis was created:
| RSI (14): | 61.21 | |
| MACD (12,26,9): | 0.0000 | |
| Directional Movement: | 20.075564 | |
| AROON (14): | 64.285714 | |
| DEMA (21): | 0.000026 | |
| Parabolic SAR (0,02-0,02-0,2): | 0.000023 | |
| Elder Ray (13): | 0.000001 | |
| Super Trend (3,10): | 0.000022 | |
| Zig ZAG (10): | 0.000027 | |
| VORTEX (21): | 1.1176 | |
| Stochastique (14,3,5): | 54.17 | |
| TEMA (21): | 0.000027 | |
| Williams %R (14): | -37.50 | |
| Chande Momentum Oscillator (20): | 0.000004 | |
| Repulse (5,40,3): | 3.1843 | |
| ROCnROLL: | 1 | |
| TRIX (15,9): | 0.1645 | |
| Courbe Coppock: | 32.31 |
| MA7: | 0.000027 | |
| MA20: | 0.000024 | |
| MA50: | 0.000025 | |
| MA100: | 0.000027 | |
| MAexp7: | 0.000026 | |
| MAexp20: | 0.000025 | |
| MAexp50: | 0.000025 | |
| MAexp100: | 0.000026 | |
| Price / MA7: | -3.70% | |
| Price / MA20: | +8.33% | |
| Price / MA50: | +4.00% | |
| Price / MA100: | -3.70% | |
| Price / MAexp7: | -0% | |
| Price / MAexp20: | +4.00% | |
| Price / MAexp50: | +4.00% | |
| Price / MAexp100: | -0% |
About author

Online


Add a comment
Comments
0 comments on the analysis SHIBA INU - SHIB/USD - Daily