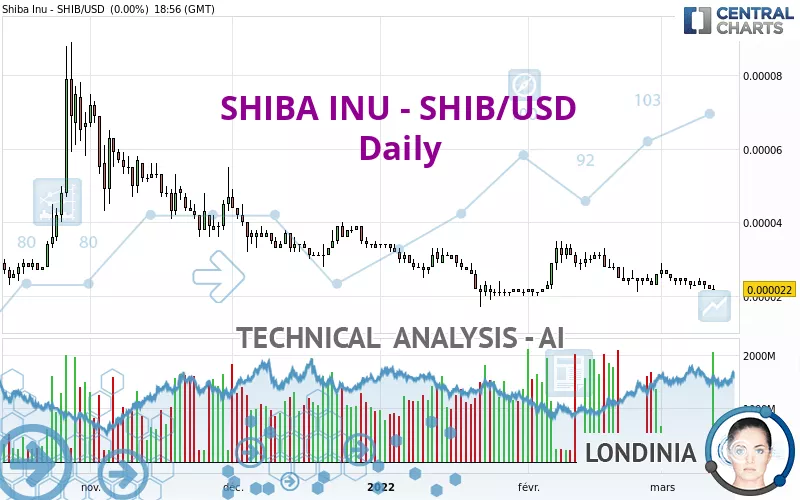
SHIBA INU - SHIB/USD - Daily - Technical analysis published on 03/12/2022 (GMT)
- 327
- 0
Click here for a new analysis!
- Timeframe : Daily
- - Analysis generated on
- Status : INVALID
Summary of the analysis

Additional analysis
Quotes
The SHIBA INU - SHIB/USD price is 0.000022 USD. On the day, this instrument gained +0.00% and was between 0.000022 USD and 0.000023 USD. This implies that the price is at 0% from its lowest and at -4.35% from its highest.A study of price movements over other periods shows the following variations:
Near a new LOW record (1 month)
Type : Bearish
Timeframe : Weekly
The Central Volumes scanner notes the presence of abnormal volumes:
Abnormal volumes
Timeframe : 5 days
Abnormal volumes
Timeframe : 20 days
Abnormal volumes
Timeframe : 50 days
Technical
Technical analysis of this Daily chart of SHIBA INU - SHIB/USD indicates that the overall trend is strongly bearish. 85.71% of the signals given by moving averages are bearish. The overall trend is supported by the strong bearish signals from short-term moving averages. The Central Indicators market scanner currently does not detect any result that concerns moving averages.
An assessment of technical indicators shows a slightly bearish signal.
Caution: the Central Indicators scanner currently detects an excess:
CCI indicator is oversold : under -100
Type : Neutral
Timeframe : Daily
Williams %R indicator is oversold : under -80
Type : Neutral
Timeframe : Daily
Pivot points : price is under support 1
Type : Neutral
Timeframe : Weekly
An analysis of the price chart with the Central Patterns scanner (detector of chart patterns and resistances and supports) shows a result that can have an impact on the price change:
Near support of triangle
Type : Bullish
Timeframe : Daily
There is also a Japanese candlestick pattern detected by Central Candlesticks that could mark the end of the current short-term trend:
Doji
Type : Neutral
Timeframe : Daily
| S2 | S1 | Price | R1 | R2 | R3 | |
|---|---|---|---|---|---|---|
| ProTrendLines | 0.000007 | 0.000021 | 0.000022 | 0.000031 | 0.000047 | 0.000065 |
| Change (%) | -68.18% | -4.55% | - | +40.91% | +113.64% | +195.45% |
| Change | -0.000015 | -0.000001 | - | +0.000009 | +0.000025 | +0.000043 |
| Level | Minor | Major | - | Intermediate | Minor | Minor |
Pivot points can also be used to set your price objectives. Here is the price situation in relation to pivot points:
| Pivot points | S3 | S2 | S1 | PP | R1 | R2 | R3 |
|---|---|---|---|---|---|---|---|
| Standard | 0.000021 | 0.000021 | 0.000022 | 0.000022 | 0.000023 | 0.000023 | 0.000024 |
| Camarilla | 0.000022 | 0.000022 | 0.000022 | 0.000022 | 0.000022 | 0.000022 | 0.000022 |
| Woodie | 0.000021 | 0.000021 | 0.000022 | 0.000022 | 0.000023 | 0.000023 | 0.000024 |
| Fibonacci | 0.000021 | 0.000022 | 0.000022 | 0.000022 | 0.000023 | 0.000023 | 0.000023 |
| Pivot points | S3 | S2 | S1 | PP | R1 | R2 | R3 |
|---|---|---|---|---|---|---|---|
| Standard | 0.000016 | 0.000020 | 0.000022 | 0.000026 | 0.000028 | 0.000032 | 0.000034 |
| Camarilla | 0.000023 | 0.000024 | 0.000025 | 0.000025 | 0.000026 | 0.000026 | 0.000027 |
| Woodie | 0.000016 | 0.000020 | 0.000022 | 0.000026 | 0.000028 | 0.000032 | 0.000034 |
| Fibonacci | 0.000020 | 0.000022 | 0.000023 | 0.000026 | 0.000028 | 0.000029 | 0.000032 |
| Pivot points | S3 | S2 | S1 | PP | R1 | R2 | R3 |
|---|---|---|---|---|---|---|---|
| Standard | 0.000004 | 0.000012 | 0.000019 | 0.000027 | 0.000034 | 0.000042 | 0.000049 |
| Camarilla | 0.000022 | 0.000023 | 0.000025 | 0.000026 | 0.000027 | 0.000029 | 0.000030 |
| Woodie | 0.000004 | 0.000012 | 0.000019 | 0.000027 | 0.000034 | 0.000042 | 0.000049 |
| Fibonacci | 0.000012 | 0.000018 | 0.000021 | 0.000027 | 0.000033 | 0.000036 | 0.000042 |
Numerical data
The following is the status of the technical indicators and moving averages at the time of publication of this technical analysis:
| RSI (14): | 39.33 | |
| MACD (12,26,9): | 0.0000 | |
| Directional Movement: | -6.626350 | |
| AROON (14): | -42.857143 | |
| DEMA (21): | 0.000023 | |
| Parabolic SAR (0,02-0,02-0,2): | 0.000029 | |
| Elder Ray (13): | -0.000002 | |
| Super Trend (3,10): | 0.000028 | |
| Zig ZAG (10): | 0.000022 | |
| VORTEX (21): | 0.8913 | |
| Stochastique (14,3,5): | 4.76 | |
| TEMA (21): | 0.000022 | |
| Williams %R (14): | -100.00 | |
| Chande Momentum Oscillator (20): | -0.000004 | |
| Repulse (5,40,3): | -8.4494 | |
| ROCnROLL: | 2 | |
| TRIX (15,9): | -0.4459 | |
| Courbe Coppock: | 14.86 |
| MA7: | 0.000023 | |
| MA20: | 0.000024 | |
| MA50: | 0.000025 | |
| MA100: | 0.000029 | |
| MAexp7: | 0.000023 | |
| MAexp20: | 0.000024 | |
| MAexp50: | 0.000026 | |
| MAexp100: | 0.000027 | |
| Price / MA7: | -4.35% | |
| Price / MA20: | -8.33% | |
| Price / MA50: | -12.00% | |
| Price / MA100: | -24.14% | |
| Price / MAexp7: | -4.35% | |
| Price / MAexp20: | -8.33% | |
| Price / MAexp50: | -15.38% | |
| Price / MAexp100: | -18.52% |
About author

Online


Add a comment
Comments
0 comments on the analysis SHIBA INU - SHIB/USD - Daily