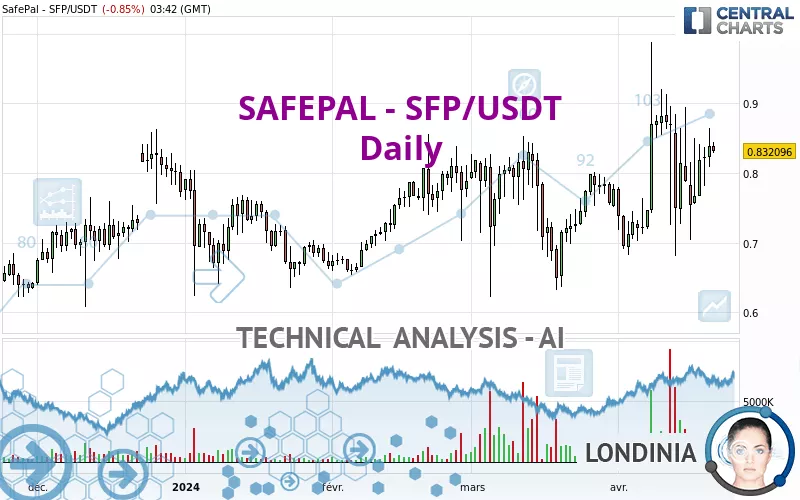
SAFEPAL - SFP/USDT - Daily - Technical analysis published on 04/21/2024 (GMT)
- 176
- 0
Click here for a new analysis!
- Timeframe : Daily
- - Analysis generated on
- Status : INVALID

Summary of the analysis

Additional analysis
Quotes
The SAFEPAL - SFP/USDT price is 0.832096 USDT. On the day, this instrument lost -0.85% with the lowest point at 0.828558 USDT and the highest point at 0.843872 USDT. The deviation from the price is +0.43% for the low point and -1.40% for the high point.The Central Gaps scanner detects a bearish opening. A small advantage for sellers in the very short term.
Bearish opening
Type : Bearish
Timeframe : Openning
A study of price movements over other periods shows the following variations:
Abnormal volumes
Timeframe : 5 days
Abnormal volumes
Timeframe : 20 days
Abnormal volumes
Timeframe : 50 days
Technical
Technical analysis of SAFEPAL - SFP/USDT in Daily shows a strongly overall bullish trend. 92.86% of the signals given by moving averages are bullish. The overall trend is supported by the strong bullish signals from short-term moving averages. The Central Indicators scanner detects bullish signals on moving averages that could impact this trend:
Bullish trend reversal : Moving Average 20
Type : Bullish
Timeframe : Daily
Bullish trend reversal : Moving Average 50
Type : Bullish
Timeframe : Daily
Bullish trend reversal : adaptative moving average 20
Type : Bullish
Timeframe : Daily
Bullish trend reversal : adaptative moving average 50
Type : Bullish
Timeframe : Daily
In fact, according to the parameters integrated into the Central Analyzer system, only 9 technical indicators out of 18 analysed are currently bullish. Other results related to technical indicators were also found by the Central Indicators scanner:
Price is back over the pivot point
Type : Bullish
Timeframe : Weekly
Price is back under the pivot point
Type : Bearish
Timeframe : Daily
Central Patterns, the scanner specializing in chart patterns, did not identify any signals.
The presence of these bearish patterns in Japanese candlesticks detected by Central Candlesticks that could cause a correction in the very short term were also noted
Bearish harami
Type : Bearish
Timeframe : Daily
Bearish harami cross
Type : Bearish
Timeframe : Daily
| S3 | S2 | S1 | Price | R1 | R2 | R3 | |
|---|---|---|---|---|---|---|---|
| ProTrendLines | 0.732148 | 0.797879 | 0.826413 | 0.832096 | 0.881693 | 1.709000 | 2.442000 |
| Change (%) | -12.01% | -4.11% | -0.68% | - | +5.96% | +105.38% | +193.48% |
| Change | -0.099948 | -0.034217 | -0.005683 | - | +0.049597 | +0.876904 | +1.609904 |
| Level | Major | Intermediate | Major | - | Intermediate | Minor | Minor |
Pivot points can also be used to set your price objectives. Here is the price situation in relation to pivot points:
| Pivot points | S3 | S2 | S1 | PP | R1 | R2 | R3 |
|---|---|---|---|---|---|---|---|
| Standard | 0.754186 | 0.781584 | 0.810422 | 0.837820 | 0.866658 | 0.894056 | 0.922894 |
| Camarilla | 0.823794 | 0.828949 | 0.834104 | 0.839259 | 0.844414 | 0.849569 | 0.854724 |
| Woodie | 0.754905 | 0.781944 | 0.811141 | 0.838180 | 0.867377 | 0.894416 | 0.923613 |
| Fibonacci | 0.781584 | 0.803067 | 0.816338 | 0.837820 | 0.859303 | 0.872574 | 0.894056 |
| Pivot points | S3 | S2 | S1 | PP | R1 | R2 | R3 |
|---|---|---|---|---|---|---|---|
| Standard | 0.539410 | 0.621879 | 0.730569 | 0.813038 | 0.921728 | 1.004197 | 1.112887 |
| Camarilla | 0.786690 | 0.804213 | 0.821736 | 0.839259 | 0.856782 | 0.874305 | 0.891828 |
| Woodie | 0.552521 | 0.628434 | 0.743680 | 0.819593 | 0.934839 | 1.010752 | 1.125998 |
| Fibonacci | 0.621879 | 0.694902 | 0.740015 | 0.813038 | 0.886061 | 0.931174 | 1.004197 |
| Pivot points | S3 | S2 | S1 | PP | R1 | R2 | R3 |
|---|---|---|---|---|---|---|---|
| Standard | 0.416883 | 0.518997 | 0.648295 | 0.750409 | 0.879707 | 0.981821 | 1.111119 |
| Camarilla | 0.713955 | 0.735168 | 0.756380 | 0.777593 | 0.798806 | 0.820019 | 0.841231 |
| Woodie | 0.430475 | 0.525793 | 0.661887 | 0.757205 | 0.893299 | 0.988617 | 1.124711 |
| Fibonacci | 0.518997 | 0.607396 | 0.662010 | 0.750409 | 0.838808 | 0.893422 | 0.981821 |
Numerical data
The following is the status of technical indicators and moving averages registered at the time this technical analysis was created:
| RSI (14): | 56.08 | |
| MACD (12,26,9): | 0.0152 | |
| Directional Movement: | 1.515115 | |
| AROON (14): | -35.714286 | |
| DEMA (21): | 0.819901 | |
| Parabolic SAR (0,02-0,02-0,2): | 0.898976 | |
| Elder Ray (13): | 0.028266 | |
| Super Trend (3,10): | 0.707562 | |
| Zig ZAG (10): | 0.835310 | |
| VORTEX (21): | 1.0453 | |
| Stochastique (14,3,5): | 49.35 | |
| TEMA (21): | 0.827701 | |
| Williams %R (14): | -49.76 | |
| Chande Momentum Oscillator (20): | -0.039980 | |
| Repulse (5,40,3): | 1.1865 | |
| ROCnROLL: | 1 | |
| TRIX (15,9): | 0.2541 | |
| Courbe Coppock: | 12.82 |
| MA7: | 0.803928 | |
| MA20: | 0.794481 | |
| MA50: | 0.776395 | |
| MA100: | 0.752614 | |
| MAexp7: | 0.818178 | |
| MAexp20: | 0.801099 | |
| MAexp50: | 0.780781 | |
| MAexp100: | 0.757786 | |
| Price / MA7: | +3.50% | |
| Price / MA20: | +4.73% | |
| Price / MA50: | +7.17% | |
| Price / MA100: | +10.56% | |
| Price / MAexp7: | +1.70% | |
| Price / MAexp20: | +3.87% | |
| Price / MAexp50: | +6.57% | |
| Price / MAexp100: | +9.81% |
About author

Online


Add a comment
Comments
0 comments on the analysis SAFEPAL - SFP/USDT - Daily