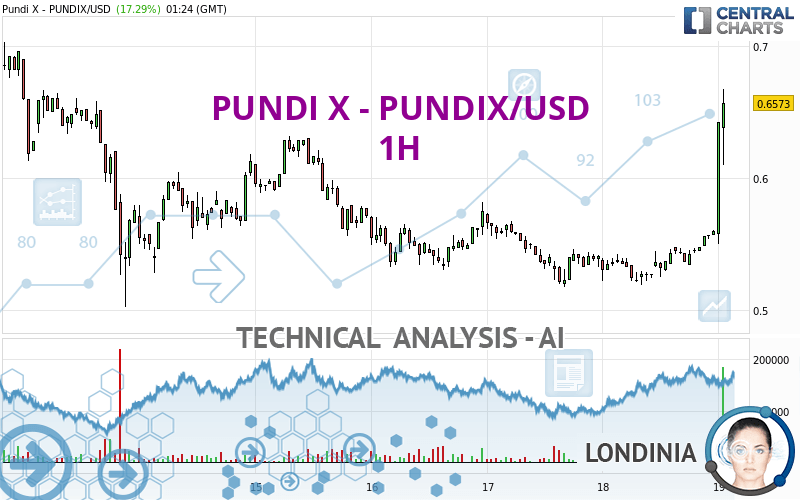
PUNDI X - PUNDIX/USD - 1H - Technical analysis published on 04/19/2024 (GMT)
- 92
- 0
Click here for a new analysis!
- Timeframe : 1H
- - Analysis generated on
- Status : INVALID

Summary of the analysis

Additional analysis
Quotes
The PUNDI X - PUNDIX/USD price is 0.657300 USD. The price registered an increase of +17.29% on the session with the lowest point at 0.550100 USD and the highest point at 0.667700 USD. The deviation from the price is +19.49% for the low point and -1.56% for the high point.A bearish opening was detected by the Central Gaps scanner. Sellers are trying to impose a bearish trend in the very short term.
Bearish opening
Type : Bearish
Timeframe : Openning
Here is a more detailed summary of the historical variations registered by PUNDI X - PUNDIX/USD:
Abnormal volumes
Timeframe : 5 days
Abnormal volumes
Timeframe : 20 days
Abnormal volumes
Timeframe : 50 days
Technical
A technical analysis in 1H of this PUNDI X - PUNDIX/USD chart shows a bullish trend. The signals returned by the moving averages are 75.00% bullish. This bullish trend is reinforced by the strong signals currently being given by short-term moving averages. The Central Indicators market scanner is currently detecting several bullish signals that could impact this trend:
Bullish trend reversal : Moving Average 100
Type : Bullish
Timeframe : 1 hour
Bullish trend reversal : adaptative moving average 100
Type : Bullish
Timeframe : 1 hour
In fact, 16 technical indicators on 18 studied are currently positioned bullish. Caution: the Central Indicators scanner currently detects an excess:
RSI indicator is overbought : over 80
Type : Neutral
Timeframe : 1 hour
CCI indicator is overbought : over 100
Type : Neutral
Timeframe : 1 hour
Previous candle closed over Bollinger bands
Type : Neutral
Timeframe : 1 hour
Williams %R indicator is overbought : over -20
Type : Neutral
Timeframe : 1 hour
Pivot points : price is over resistance 3
Type : Neutral
Timeframe : 1 hour
The analysis of the price chart with Central Patterns scanners does not return any result.
From the Japanese candlestick perspective, the Central Candlesticks scanner notes the presence of these results that could impact the short-term trend:
Bearish harami
Type : Bearish
Timeframe : 1 hour
Long white line
Type : Bullish
Timeframe : 1 hour
| S3 | S2 | S1 | Price | R1 | R2 | R3 | |
|---|---|---|---|---|---|---|---|
| ProTrendLines | 0.526400 | 0.570169 | 0.636200 | 0.657300 | 0.731600 | 0.876700 | 1.069000 |
| Change (%) | -19.91% | -13.26% | -3.21% | - | +11.30% | +33.38% | +62.64% |
| Change | -0.130900 | -0.087131 | -0.021100 | - | +0.074300 | +0.219400 | +0.411700 |
| Level | Major | Major | Intermediate | - | Minor | Major | Major |
Attention could also be paid to pivot points to set price objectives:
| Pivot points | S3 | S2 | S1 | PP | R1 | R2 | R3 |
|---|---|---|---|---|---|---|---|
| Standard | 0.491567 | 0.505533 | 0.532967 | 0.546933 | 0.574367 | 0.588333 | 0.615767 |
| Camarilla | 0.549015 | 0.552810 | 0.556605 | 0.560400 | 0.564195 | 0.567990 | 0.571785 |
| Woodie | 0.498300 | 0.508900 | 0.539700 | 0.550300 | 0.581100 | 0.591700 | 0.622500 |
| Fibonacci | 0.505533 | 0.521348 | 0.531119 | 0.546933 | 0.562748 | 0.572519 | 0.588333 |
| Pivot points | S3 | S2 | S1 | PP | R1 | R2 | R3 |
|---|---|---|---|---|---|---|---|
| Standard | -0.098533 | 0.202033 | 0.388967 | 0.689533 | 0.876467 | 1.177033 | 1.363967 |
| Camarilla | 0.441838 | 0.486525 | 0.531213 | 0.575900 | 0.620588 | 0.665275 | 0.709963 |
| Woodie | -0.155350 | 0.173625 | 0.332150 | 0.661125 | 0.819650 | 1.148625 | 1.307150 |
| Fibonacci | 0.202033 | 0.388258 | 0.503308 | 0.689533 | 0.875758 | 0.990808 | 1.177033 |
| Pivot points | S3 | S2 | S1 | PP | R1 | R2 | R3 |
|---|---|---|---|---|---|---|---|
| Standard | 0.109033 | 0.302667 | 0.484833 | 0.678467 | 0.860633 | 1.054267 | 1.236433 |
| Camarilla | 0.563655 | 0.598103 | 0.632552 | 0.667000 | 0.701448 | 0.735897 | 0.770345 |
| Woodie | 0.103300 | 0.299800 | 0.479100 | 0.675600 | 0.854900 | 1.051400 | 1.230700 |
| Fibonacci | 0.302667 | 0.446222 | 0.534911 | 0.678467 | 0.822022 | 0.910711 | 1.054267 |
Numerical data
The following is the status of the technical indicators and moving averages at the time of publication of this technical analysis:
| RSI (14): | 71.66 | |
| MACD (12,26,9): | 0.0152 | |
| Directional Movement: | 41.451253 | |
| AROON (14): | 85.714286 | |
| DEMA (21): | 0.575537 | |
| Parabolic SAR (0,02-0,02-0,2): | 0.550100 | |
| Elder Ray (13): | 0.056680 | |
| Super Trend (3,10): | 0.573858 | |
| Zig ZAG (10): | 0.626700 | |
| VORTEX (21): | 1.2425 | |
| Stochastique (14,3,5): | 99.46 | |
| TEMA (21): | 0.600328 | |
| Williams %R (14): | -5.00 | |
| Chande Momentum Oscillator (20): | 0.113100 | |
| Repulse (5,40,3): | 19.0487 | |
| ROCnROLL: | 1 | |
| TRIX (15,9): | 0.1590 | |
| Courbe Coppock: | 21.11 |
| MA7: | 0.584014 | |
| MA20: | 0.685180 | |
| MA50: | 0.659414 | |
| MA100: | 0.546873 | |
| MAexp7: | 0.593927 | |
| MAexp20: | 0.559225 | |
| MAexp50: | 0.552291 | |
| MAexp100: | 0.570605 | |
| Price / MA7: | +12.55% | |
| Price / MA20: | -4.07% | |
| Price / MA50: | -0.32% | |
| Price / MA100: | +20.19% | |
| Price / MAexp7: | +10.67% | |
| Price / MAexp20: | +17.54% | |
| Price / MAexp50: | +19.01% | |
| Price / MAexp100: | +15.19% |
About author
Online


Add a comment
Comments
0 comments on the analysis PUNDI X - PUNDIX/USD - 1H