MICRO BITCOIN FULL0225 - Daily - Technical analysis published on 11/15/2024 (GMT)
- 94
- 0
- Timeframe : Daily
- - Analysis generated on
- Status : WITHOUT TARGET
Summary of the analysis

Additional analysis
Quotes
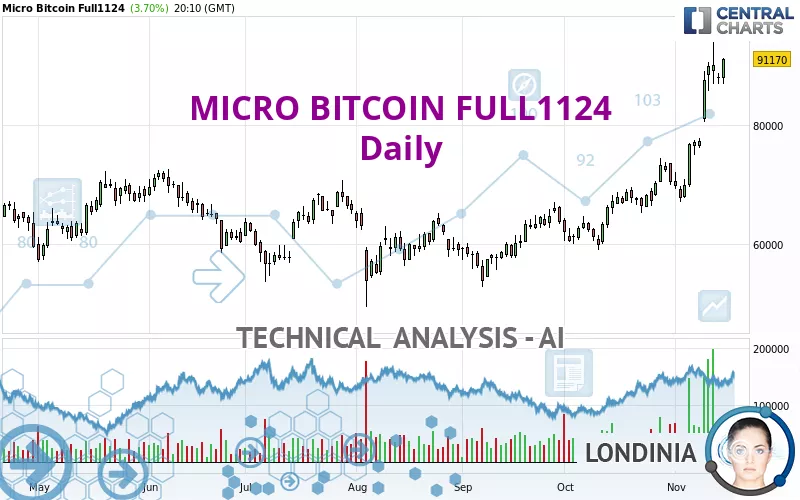
The MICRO BITCOIN FULL1124 price is 91,170 USD. The price registered an increase of +3.70% on the session with the lowest point at 86,970 USD and the highest point at 91,340 USD. The deviation from the price is +4.83% for the low point and -0.19% for the high point.The Central Gaps scanner detects a bullish opening marking the presence of buyers ahead of sellers at the opening but not sufficiently marked to allow the price to register a quotation gap.
Bullish opening
Type : Bullish
Timeframe : Openning
Here is a more detailed summary of the historical variations registered by MICRO BITCOIN FULL1124:
New HIGH record (5 years)
Type : Bullish
Timeframe : Weekly
Near a new HIGH record (1 year)
Type : Bullish
Timeframe : Weekly
Near a new HIGH record (1st january)
Type : Bullish
Timeframe : Weekly
Near a new HIGH record (1 month)
Type : Bullish
Timeframe : Weekly
The Central Volumes scanner detects abnormal volumes on the asset:
Abnormal volumes
Timeframe : 5 days
Abnormal volumes
Timeframe : 20 days
Technical
Technical analysis of this Daily chart of MICRO BITCOIN FULL1124 indicates that the overall trend is strongly bullish. 92.86% of the signals given by moving averages are bullish. The overall trend is supported by the strong bullish signals from short-term moving averages. The Central Indicators scanner does not detect any result on moving averages that would impact this trend.
In fact, according to the parameters integrated into the Central Analyzer system, 13 technical indicators out of 18 analysed are currently bullish. But beware of excesses. The Central Indicators scanner currently detects this:
RSI indicator is overbought : over 70
Type : Neutral
Timeframe : Daily
CCI indicator is overbought : over 100
Type : Neutral
Timeframe : Daily
Williams %R indicator is overbought : over -20
Type : Neutral
Timeframe : Daily
Pivot points : price is over resistance 2
Type : Neutral
Timeframe : Weekly
Price is back over the pivot point
Type : Bullish
Timeframe : Daily
The analysis of the price chart with Central Patterns scanners does not return any result.
The Central Candlesticks scanner which studies Japanese candlesticks did not detect anything.
| S3 | S2 | S1 | Price | |
|---|---|---|---|---|
| ProTrendLines | 60,903 | 70,565 | 77,160 | 91,170 |
| Change (%) | -33.20% | -22.60% | -15.37% | - |
| Change | -30,267 | -20,605 | -14,010 | - |
| Level | Minor | Intermediate | Major | - |
To determine price objectives, it is also possible to use the pivot points. Here is the price position in relation to pivot points:
| Pivot points | S3 | S2 | S1 | PP | R1 | R2 | R3 |
|---|---|---|---|---|---|---|---|
| Standard | 81,017 | 84,163 | 86,042 | 89,188 | 91,067 | 94,213 | 96,092 |
| Camarilla | 86,538 | 86,999 | 87,459 | 87,920 | 88,381 | 88,841 | 89,302 |
| Woodie | 80,383 | 83,846 | 85,408 | 88,871 | 90,433 | 93,896 | 95,458 |
| Fibonacci | 84,163 | 86,083 | 87,269 | 89,188 | 91,108 | 92,294 | 94,213 |
| Pivot points | S3 | S2 | S1 | PP | R1 | R2 | R3 |
|---|---|---|---|---|---|---|---|
| Standard | 59,543 | 63,337 | 70,348 | 74,142 | 81,153 | 84,947 | 91,958 |
| Camarilla | 74,389 | 75,379 | 76,370 | 77,360 | 78,350 | 79,341 | 80,331 |
| Woodie | 61,153 | 64,141 | 71,958 | 74,946 | 82,763 | 85,751 | 93,568 |
| Fibonacci | 63,337 | 67,464 | 70,014 | 74,142 | 78,269 | 80,819 | 84,947 |
| Pivot points | S3 | S2 | S1 | PP | R1 | R2 | R3 |
|---|---|---|---|---|---|---|---|
| Standard | 46,552 | 53,083 | 61,407 | 67,938 | 76,262 | 82,793 | 91,117 |
| Camarilla | 65,645 | 67,007 | 68,368 | 69,730 | 71,092 | 72,453 | 73,815 |
| Woodie | 47,448 | 53,531 | 62,303 | 68,386 | 77,158 | 83,241 | 92,013 |
| Fibonacci | 53,083 | 58,758 | 62,264 | 67,938 | 73,613 | 77,119 | 82,793 |
Numerical data
The following are the details of the technical indicators and moving averages that were collected to generate this technical analysis:
| RSI (14): | 76.00 | |
| MACD (12,26,9): | 6,179.0000 | |
| Directional Movement: | 31 | |
| AROON (14): | 50 | |
| DEMA (21): | 85,212 | |
| Parabolic SAR (0,02-0,02-0,2): | 77,053 | |
| Elder Ray (13): | 7,738 | |
| Super Trend (3,10): | 77,512 | |
| Zig ZAG (10): | 90,795 | |
| VORTEX (21): | 1.0000 | |
| Stochastique (14,3,5): | 84.00 | |
| TEMA (21): | 89,115 | |
| Williams %R (14): | -12.00 | |
| Chande Momentum Oscillator (20): | 18,485 | |
| Repulse (5,40,3): | 6.0000 | |
| ROCnROLL: | 1 | |
| TRIX (15,9): | 1.0000 | |
| Courbe Coppock: | 47.00 |
| MA7: | 85,946 | |
| MA20: | 75,620 | |
| MA50: | 68,309 | |
| MA100: | 65,524 | |
| MAexp7: | 85,963 | |
| MAexp20: | 78,010 | |
| MAexp50: | 71,244 | |
| MAexp100: | 67,787 | |
| Price / MA7: | +6.08% | |
| Price / MA20: | +20.56% | |
| Price / MA50: | +33.47% | |
| Price / MA100: | +39.14% | |
| Price / MAexp7: | +6.06% | |
| Price / MAexp20: | +16.87% | |
| Price / MAexp50: | +27.97% | |
| Price / MAexp100: | +34.49% |
About author

Online


Add a comment
Comments
0 comments on the analysis MICRO BITCOIN FULL0225 - Daily