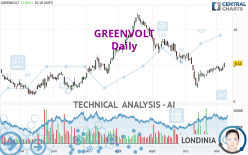
GREENVOLT - Daily - Technical analysis published on 11/08/2022 (GMT)
- 105
- 0
- Timeframe : Daily
- - Analysis generated on
- Status : NEUTRAL

Summary of the analysis

Additional analysis
Quotes
The GREENVOLT rating is 8.12 EUR. The price registered an increase of +2.92% on the session with the lowest point at 7.88 EUR and the highest point at 8.15 EUR. The deviation from the price is +3.05% for the low point and -0.37% for the high point.The Central Gaps scanner detects a bullish opening. A small advantage for buyers in the very short term.
Bullish opening
Type : Bullish
Timeframe : Openning
So that you have an overall view of the price change, here is a table showing the variations over several periods:
New HIGH record (1 month)
Type : Bullish
Timeframe : Weekly
Technical
Technical analysis of this Daily chart of GREENVOLT indicates that the overall trend is slightly bearish. 60.71% of the signals given by moving averages are bearish. As the signals currently given by short-term moving averages are rather neutral, the slightly bearish trend could return to neutral. The Central Indicators scanner detects bullish signals on moving averages that could impact this trend:
Bullish trend reversal : Moving Average 20
Type : Bullish
Timeframe : Daily
Bullish trend reversal : adaptative moving average 20
Type : Bullish
Timeframe : Daily
In fact, 13 technical indicators on 18 studied are currently bullish. Caution: the Central Indicators scanner currently detects an excess:
CCI indicator is overbought : over 100
Type : Neutral
Timeframe : Daily
Williams %R indicator is overbought : over -20
Type : Neutral
Timeframe : Daily
Pivot points : price is over resistance 1
Type : Neutral
Timeframe : Weekly
Pivot points : price is over resistance 2
Type : Neutral
Timeframe : Daily
RSI indicator is back over 50
Type : Bullish
Timeframe : Daily
SuperTrend indicator bullish reversal
Type : Bullish
Timeframe : Daily
An analysis of the price chart with the Central Patterns scanner (detector of chart patterns and resistances and supports) shows a result that can have an impact on the price change:
Horizontal resistance is broken
Type : Bullish
Timeframe : Daily
No result was found by the Central Candlesticks scanner on Japanese candlesticks.
| S3 | S2 | S1 | Price | R1 | R2 | R3 | |
|---|---|---|---|---|---|---|---|
| ProTrendLines | 6.91 | 7.56 | 7.98 | 8.12 | 8.42 | 9.34 | 10.80 |
| Change (%) | -14.90% | -6.90% | -1.72% | - | +3.69% | +15.02% | +33.00% |
| Change | -1.21 | -0.56 | -0.14 | - | +0.30 | +1.22 | +2.68 |
| Level | Intermediate | Major | Major | - | Major | Minor | Intermediate |
To determine price objectives, it is also possible to use the pivot points. Here is the price position in relation to pivot points:
| Pivot points | S3 | S2 | S1 | PP | R1 | R2 | R3 |
|---|---|---|---|---|---|---|---|
| Standard | 7.51 | 7.62 | 7.75 | 7.86 | 7.99 | 8.10 | 8.23 |
| Camarilla | 7.82 | 7.85 | 7.87 | 7.89 | 7.91 | 7.93 | 7.96 |
| Woodie | 7.53 | 7.63 | 7.77 | 7.87 | 8.01 | 8.11 | 8.25 |
| Fibonacci | 7.62 | 7.71 | 7.77 | 7.86 | 7.95 | 8.01 | 8.10 |
| Pivot points | S3 | S2 | S1 | PP | R1 | R2 | R3 |
|---|---|---|---|---|---|---|---|
| Standard | 7.19 | 7.40 | 7.55 | 7.76 | 7.91 | 8.12 | 8.27 |
| Camarilla | 7.59 | 7.62 | 7.66 | 7.69 | 7.72 | 7.76 | 7.79 |
| Woodie | 7.15 | 7.39 | 7.51 | 7.75 | 7.87 | 8.11 | 8.23 |
| Fibonacci | 7.40 | 7.54 | 7.63 | 7.76 | 7.90 | 7.99 | 8.12 |
| Pivot points | S3 | S2 | S1 | PP | R1 | R2 | R3 |
|---|---|---|---|---|---|---|---|
| Standard | 4.85 | 5.81 | 6.79 | 7.75 | 8.73 | 9.69 | 10.67 |
| Camarilla | 7.25 | 7.42 | 7.60 | 7.78 | 7.96 | 8.14 | 8.31 |
| Woodie | 4.87 | 5.82 | 6.81 | 7.76 | 8.75 | 9.70 | 10.69 |
| Fibonacci | 5.81 | 6.55 | 7.01 | 7.75 | 8.49 | 8.95 | 9.69 |
Numerical data
The following are the details of the technical indicators and moving averages that were collected to generate this technical analysis:
| RSI (14): | 55.17 | |
| MACD (12,26,9): | -0.0800 | |
| Directional Movement: | 4.24 | |
| AROON (14): | 92.86 | |
| DEMA (21): | 7.68 | |
| Parabolic SAR (0,02-0,02-0,2): | 7.59 | |
| Elder Ray (13): | 0.19 | |
| Super Trend (3,10): | 7.28 | |
| Zig ZAG (10): | 8.12 | |
| VORTEX (21): | 0.9900 | |
| Stochastique (14,3,5): | 80.48 | |
| TEMA (21): | 7.84 | |
| Williams %R (14): | -3.49 | |
| Chande Momentum Oscillator (20): | 0.63 | |
| Repulse (5,40,3): | 4.3700 | |
| ROCnROLL: | -1 | |
| TRIX (15,9): | -0.3500 | |
| Courbe Coppock: | 12.07 |
| MA7: | 7.87 | |
| MA20: | 7.64 | |
| MA50: | 8.32 | |
| MA100: | 8.52 | |
| MAexp7: | 7.88 | |
| MAexp20: | 7.86 | |
| MAexp50: | 8.16 | |
| MAexp100: | 8.17 | |
| Price / MA7: | +3.18% | |
| Price / MA20: | +6.28% | |
| Price / MA50: | -2.40% | |
| Price / MA100: | -4.69% | |
| Price / MAexp7: | +3.05% | |
| Price / MAexp20: | +3.31% | |
| Price / MAexp50: | -0.49% | |
| Price / MAexp100: | -0.61% |
About author
Online


Add a comment
Comments
0 comments on the analysis GREENVOLT - Daily