ABBOTT LABORATORIES - 1H - Technical analysis published on 12/03/2024 (GMT)
- 123
- 0
Click here for a new analysis!
- Timeframe : 1H
- - Analysis generated on
- Status : LEVEL MAINTAINED
Summary of the analysis

Additional analysis
Quotes
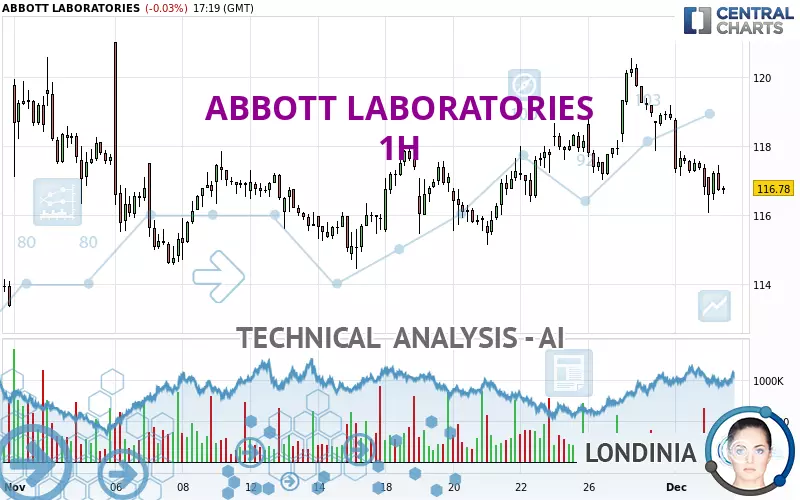
The ABBOTT LABORATORIES rating is 116.78 USD. The price is lower by -0.03% since the last closing with the lowest point at 116.07 USD and the highest point at 117.44 USD. The deviation from the price is +0.61% for the low point and -0.56% for the high point.Here is a more detailed summary of the historical variations registered by ABBOTT LABORATORIES:
Near a new HIGH record (1 year)
Type : Bullish
Timeframe : Weekly
Near a new HIGH record (1st january)
Type : Bullish
Timeframe : Weekly
Near a new HIGH record (1 month)
Type : Bullish
Timeframe : Weekly
Technical
Technical analysis of ABBOTT LABORATORIES in 1H shows an overall bearish trend. The signals given by moving averages are 67.86% bearish. This bearish trend is reinforced by the strong signals currently being given by short-term moving averages. The Central Indicators scanner detects a bearish signal on moving averages that could impact this trend:
Bearish price crossover with adaptative moving average 100
Type : Bearish
Timeframe : 1 hour
The technical indicators are generally neutral. They do not provide relevant information on the direction of future price movements.
Central Indicators, the detector scanner for these technical indicators recently detected a signal:
Pivot points : price is under support 1
Type : Neutral
Timeframe : Weekly
The Central Patterns scanner, which studies chart patterns, resistances and supports, has identified this signal:
Near support of channel
Type : Bullish
Timeframe : 1 hour
The presence of these bullish Japanese candlestick patterns detected by Central Candlesticks that could cause a very short term rebound were also noted:
Bullish harami
Type : Bullish
Timeframe : 1 hour
Bullish harami cross
Type : Bullish
Timeframe : 1 hour
| S3 | S2 | S1 | Price | R1 | R2 | R3 | |
|---|---|---|---|---|---|---|---|
| ProTrendLines | 113.21 | 114.49 | 116.35 | 116.78 | 117.01 | 117.89 | 119.01 |
| Change (%) | -3.06% | -1.96% | -0.37% | - | +0.20% | +0.95% | +1.91% |
| Change | -3.57 | -2.29 | -0.43 | - | +0.23 | +1.11 | +2.23 |
| Level | Minor | Major | Minor | - | Intermediate | Intermediate | Major |
To determine price objectives, it is also possible to use the pivot points. Here is the price position in relation to pivot points:
| Pivot points | S3 | S2 | S1 | PP | R1 | R2 | R3 |
|---|---|---|---|---|---|---|---|
| Standard | 113.78 | 115.18 | 116.00 | 117.40 | 118.22 | 119.62 | 120.44 |
| Camarilla | 116.20 | 116.40 | 116.61 | 116.81 | 117.01 | 117.22 | 117.42 |
| Woodie | 113.48 | 115.04 | 115.70 | 117.26 | 117.92 | 119.48 | 120.14 |
| Fibonacci | 115.18 | 116.03 | 116.56 | 117.40 | 118.25 | 118.78 | 119.62 |
| Pivot points | S3 | S2 | S1 | PP | R1 | R2 | R3 |
|---|---|---|---|---|---|---|---|
| Standard | 113.52 | 115.26 | 117.04 | 118.78 | 120.56 | 122.30 | 124.08 |
| Camarilla | 117.84 | 118.17 | 118.49 | 118.81 | 119.13 | 119.46 | 119.78 |
| Woodie | 113.53 | 115.27 | 117.05 | 118.79 | 120.57 | 122.31 | 124.09 |
| Fibonacci | 115.26 | 116.61 | 117.44 | 118.78 | 120.13 | 120.96 | 122.30 |
| Pivot points | S3 | S2 | S1 | PP | R1 | R2 | R3 |
|---|---|---|---|---|---|---|---|
| Standard | 108.59 | 111.51 | 115.16 | 118.08 | 121.73 | 124.65 | 128.30 |
| Camarilla | 117.00 | 117.61 | 118.21 | 118.81 | 119.41 | 120.02 | 120.62 |
| Woodie | 108.96 | 111.69 | 115.53 | 118.26 | 122.10 | 124.83 | 128.67 |
| Fibonacci | 111.51 | 114.02 | 115.57 | 118.08 | 120.59 | 122.14 | 124.65 |
Numerical data
The following is the status of the technical indicators and moving averages at the time of publication of this technical analysis:
| RSI (14): | 39.65 | |
| MACD (12,26,9): | -0.3700 | |
| Directional Movement: | -15.34 | |
| AROON (14): | -57.14 | |
| DEMA (21): | 117.24 | |
| Parabolic SAR (0,02-0,02-0,2): | 118.32 | |
| Elder Ray (13): | -0.63 | |
| Super Trend (3,10): | 118.50 | |
| Zig ZAG (10): | 116.72 | |
| VORTEX (21): | 0.8900 | |
| Stochastique (14,3,5): | 25.48 | |
| TEMA (21): | 116.70 | |
| Williams %R (14): | -80.77 | |
| Chande Momentum Oscillator (20): | -2.26 | |
| Repulse (5,40,3): | -0.4000 | |
| ROCnROLL: | 2 | |
| TRIX (15,9): | -0.0200 | |
| Courbe Coppock: | 3.59 |
| MA7: | 117.88 | |
| MA20: | 116.96 | |
| MA50: | 115.70 | |
| MA100: | 112.86 | |
| MAexp7: | 117.00 | |
| MAexp20: | 117.59 | |
| MAexp50: | 117.62 | |
| MAexp100: | 117.30 | |
| Price / MA7: | -0.93% | |
| Price / MA20: | -0.15% | |
| Price / MA50: | +0.93% | |
| Price / MA100: | +3.47% | |
| Price / MAexp7: | -0.19% | |
| Price / MAexp20: | -0.69% | |
| Price / MAexp50: | -0.71% | |
| Price / MAexp100: | -0.44% |
News
The latest news and videos published on ABBOTT LABORATORIES at the time of the analysis were as follows:
-
 Border czar Tom Homan, Gov. Abbott greet, serve meals to officials at border
- Abbott Announces First Step Toward Its Software-Guided Balloon-Expandable TAVI System to Treat Aortic Stenosis
- Abbott Initiates New Clinical Trial to Improve Outcomes in Patients with Advanced Heart Failure
- Abbott and the Big Ten Conference Tackle U.S. Blood Shortages With First-of-Its-Kind, Nationwide Blood Donation Competition, 'The We Give Blood Drive'
- Helping People Recover From Devastating Hurricanes
About author
Online


Add a comment
Comments
0 comments on the analysis ABBOTT LABORATORIES - 1H