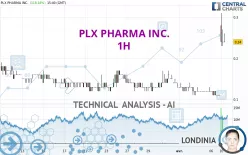
PLX PHARMA INC. - 1H - Technical analysis published on 04/10/2023 (GMT)
- 117
- 0
Click here for a new analysis!
- Timeframe : 1H
- - Analysis generated on
- Status : INVALID

Summary of the analysis
Additional analysis
Quotes
PLX PHARMA INC. rating 0.24 USD. The price has increased by +118.18% since the last closing with the lowest point at 0.23 USD and the highest point at 0.31 USD. The deviation from the price is +4.35% for the low point and -22.58% for the high point.A bullish gap was detected at the opening by the Central Gaps scanner. There are a lot of buyers and they have the upper hand in the very short term.
Opening Gap UP
Type : Bullish
Timeframe : Openning
A study of price movements over other periods shows the following variations:
Near a new HIGH record (1st january)
Type : Bullish
Timeframe : Weekly
New HIGH record (1 month)
Type : Bullish
Timeframe : Weekly
The Central Volumes scanner notes the presence of abnormal volumes:
Abnormal volumes
Timeframe : 5 days
Abnormal volumes
Timeframe : 20 days
Abnormal volumes
Timeframe : 50 days
Technical
A technical analysis in 1H of this PLX PHARMA INC. chart shows a bullish trend. The signals given by moving averages are 67.86% bullish. This bullish trend is slowing down slightly given the slightly bullish signals of short-term moving averages. An assessment of moving averages reveals several bullish signals that could impact this trend:
Bullish trend reversal : adaptative moving average 50
Type : Bullish
Timeframe : 1 hour
Bullish trend reversal : adaptative moving average 100
Type : Bullish
Timeframe : 1 hour
Moving Average bullish crossovers : AMA20 & AMA50
Type : Bullish
Timeframe : 1 hour
The probability of a further increase is high given the direction of the technical indicators.
But beware of excesses. The Central Indicators scanner currently detects this:
RSI indicator is overbought : over 80
Type : Neutral
Timeframe : 1 hour
CCI indicator is overbought : over 100
Type : Neutral
Timeframe : 1 hour
Previous candle closed over Bollinger bands
Type : Neutral
Timeframe : 1 hour
RSI indicator: bullish divergence
Type : Bullish
Timeframe : 1 hour
Pivot points : price is over resistance 3
Type : Neutral
Timeframe : 1 hour
Pivot points : price is over resistance 3
Type : Neutral
Timeframe : Weekly
The analysis of the price chart with Central Patterns scanners does not return any result.
Central Candlesticks, the scanner specialised in Japanese candlesticks, detects these signals that could have an impact on the current short-term trend:
Bullish harami
Type : Bullish
Timeframe : 1 hour
Bullish harami cross
Type : Bullish
Timeframe : 1 hour
Long black line
Type : Bearish
Timeframe : 1 hour
| S3 | S2 | S1 | Price | R1 | R2 | R3 | |
|---|---|---|---|---|---|---|---|
| ProTrendLines | 0.16 | 0.17 | 0.19 | 0.24 | 0.65 | 1.98 | 2.59 |
| Change (%) | -33.33% | -29.17% | -20.83% | - | +170.83% | +725.00% | +979.17% |
| Change | -0.08 | -0.07 | -0.05 | - | +0.41 | +1.74 | +2.35 |
| Level | Intermediate | Intermediate | Intermediate | - | Minor | Major | Intermediate |
To determine price objectives, it is also possible to use the pivot points. Here is the price position in relation to pivot points:
| Pivot points | S3 | S2 | S1 | PP | R1 | R2 | R3 |
|---|---|---|---|---|---|---|---|
| Standard | 0.07 | 0.09 | 0.09 | 0.11 | 0.11 | 0.13 | 0.13 |
| Camarilla | 0.10 | 0.10 | 0.10 | 0.10 | 0.10 | 0.10 | 0.11 |
| Woodie | 0.07 | 0.09 | 0.09 | 0.11 | 0.11 | 0.13 | 0.13 |
| Fibonacci | 0.09 | 0.09 | 0.10 | 0.11 | 0.11 | 0.12 | 0.13 |
| Pivot points | S3 | S2 | S1 | PP | R1 | R2 | R3 |
|---|---|---|---|---|---|---|---|
| Standard | 0.05 | 0.07 | 0.09 | 0.11 | 0.13 | 0.15 | 0.17 |
| Camarilla | 0.09 | 0.09 | 0.10 | 0.10 | 0.10 | 0.11 | 0.11 |
| Woodie | 0.04 | 0.07 | 0.08 | 0.11 | 0.12 | 0.15 | 0.16 |
| Fibonacci | 0.07 | 0.09 | 0.10 | 0.11 | 0.13 | 0.14 | 0.15 |
| Pivot points | S3 | S2 | S1 | PP | R1 | R2 | R3 |
|---|---|---|---|---|---|---|---|
| Standard | 0.03 | 0.08 | 0.10 | 0.15 | 0.17 | 0.22 | 0.24 |
| Camarilla | 0.11 | 0.12 | 0.12 | 0.13 | 0.14 | 0.14 | 0.15 |
| Woodie | 0.03 | 0.07 | 0.10 | 0.14 | 0.17 | 0.21 | 0.24 |
| Fibonacci | 0.08 | 0.10 | 0.12 | 0.15 | 0.17 | 0.19 | 0.22 |
Numerical data
The following are the details of the technical indicators and moving averages that were collected to generate this technical analysis:
| RSI (14): | 84.69 | |
| MACD (12,26,9): | 0.0100 | |
| Directional Movement: | 62.37 | |
| AROON (14): | 21.43 | |
| DEMA (21): | 0.15 | |
| Parabolic SAR (0,02-0,02-0,2): | 0.11 | |
| Elder Ray (13): | 0.10 | |
| Super Trend (3,10): | 0.19 | |
| Zig ZAG (10): | 0.24 | |
| VORTEX (21): | 0.9400 | |
| Stochastique (14,3,5): | 47.39 | |
| TEMA (21): | 0.17 | |
| Williams %R (14): | -36.43 | |
| Chande Momentum Oscillator (20): | 0.12 | |
| Repulse (5,40,3): | -22.6300 | |
| ROCnROLL: | 1 | |
| TRIX (15,9): | 0.0300 | |
| Courbe Coppock: | 64.14 |
| MA7: | 0.14 | |
| MA20: | 0.14 | |
| MA50: | 0.19 | |
| MA100: | 0.22 | |
| MAexp7: | 0.17 | |
| MAexp20: | 0.13 | |
| MAexp50: | 0.13 | |
| MAexp100: | 0.14 | |
| Price / MA7: | +71.43% | |
| Price / MA20: | +71.43% | |
| Price / MA50: | +26.32% | |
| Price / MA100: | +9.09% | |
| Price / MAexp7: | +41.18% | |
| Price / MAexp20: | +84.62% | |
| Price / MAexp50: | +84.62% | |
| Price / MAexp100: | +71.43% |
About author

Online


Add a comment
Comments
0 comments on the analysis PLX PHARMA INC. - 1H