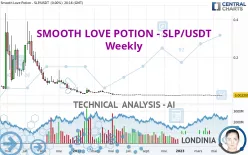
SMOOTH LOVE POTION - SLP/USDT - Weekly - Technical analysis published on 06/04/2023 (GMT)
- 194
- 0
Click here for a new analysis!
- Timeframe : Weekly
- - Analysis generated on
- Status : TARGET REACHED

Summary of the analysis

Additional analysis
Quotes
The SMOOTH LOVE POTION - SLP/USDT price is 0.002205 USDT. The price is lower by -0.77% over the 5 days and was traded between 0.002112 USDT and 0.002220 USDT over the period. The price is currently at +4.40% from its lowest point and -0.68% from its highest point.The Central Gaps scanner detects a bullish opening. A small advantage for buyers in the very short term.
Bullish opening
Type : Bullish
Timeframe : Openning
Here is a more detailed summary of the historical variations registered by SMOOTH LOVE POTION - SLP/USDT:
Near a new LOW record (1 month)
Type : Bearish
Timeframe : Weekly
Technical
Technical analysis of this Weekly chart of SMOOTH LOVE POTION - SLP/USDT indicates that the overall trend is strongly bearish. The signals given by moving averages are 92.86% bearish. This strong bearish trend is confirmed by the strong signals currently being given by short-term moving averages. The Central Indicators scanner detects a bearish signal on moving averages that could impact this trend:
Bearish trend reversal : Moving Average 20
Type : Bearish
Timeframe : Weekly
An assessment of technical indicators does not currently provide any relevant information to suggest whether the signal given by the technical indicators is more bullish or bearish.
Caution: the Central Indicators scanner currently detects an excess:
CCI indicator is oversold : under -100
Type : Neutral
Timeframe : Weekly
RSI indicator: bullish divergence
Type : Bullish
Timeframe : Weekly
Williams %R indicator is oversold : under -80
Type : Neutral
Timeframe : Weekly
No signals are given by Central Patterns, a market scanner specialised in chart patterns, resistances and supports.
The presence of these Japanese chandelier patterns detected by Central Candlesticks that could impact the current short-term trend were also noted:
Bullish harami cross
Type : Bullish
Timeframe : Weekly
Doji
Type : Neutral
Timeframe : Weekly
| Price | R1 | R2 | R3 | |
|---|---|---|---|---|
| ProTrendLines | 0.002205 | 0.003330 | 0.058210 | 0.095590 |
| Change (%) | - | +51.02% | +2,539.91% | +4,235.15% |
| Change | - | +0.001125 | +0.056005 | +0.093385 |
| Level | - | Minor | Minor | Minor |
Pivot points can also be used to set your price objectives. Here is the price situation in relation to pivot points:
| Pivot points | S3 | S2 | S1 | PP | R1 | R2 | R3 |
|---|---|---|---|---|---|---|---|
| Standard | 0.002078 | 0.002122 | 0.002164 | 0.002208 | 0.002250 | 0.002294 | 0.002336 |
| Camarilla | 0.002181 | 0.002189 | 0.002197 | 0.002205 | 0.002213 | 0.002221 | 0.002229 |
| Woodie | 0.002076 | 0.002122 | 0.002162 | 0.002208 | 0.002248 | 0.002294 | 0.002334 |
| Fibonacci | 0.002122 | 0.002155 | 0.002176 | 0.002208 | 0.002241 | 0.002262 | 0.002294 |
| Pivot points | S3 | S2 | S1 | PP | R1 | R2 | R3 |
|---|---|---|---|---|---|---|---|
| Standard | 0.001986 | 0.002049 | 0.002127 | 0.002190 | 0.002268 | 0.002331 | 0.002409 |
| Camarilla | 0.002166 | 0.002179 | 0.002192 | 0.002205 | 0.002218 | 0.002231 | 0.002244 |
| Woodie | 0.001994 | 0.002053 | 0.002135 | 0.002194 | 0.002276 | 0.002335 | 0.002417 |
| Fibonacci | 0.002049 | 0.002103 | 0.002136 | 0.002190 | 0.002244 | 0.002277 | 0.002331 |
| Pivot points | S3 | S2 | S1 | PP | R1 | R2 | R3 |
|---|---|---|---|---|---|---|---|
| Standard | 0.001370 | 0.001719 | 0.001931 | 0.002280 | 0.002492 | 0.002841 | 0.003053 |
| Camarilla | 0.001988 | 0.002039 | 0.002091 | 0.002142 | 0.002193 | 0.002245 | 0.002296 |
| Woodie | 0.001301 | 0.001685 | 0.001862 | 0.002246 | 0.002423 | 0.002807 | 0.002984 |
| Fibonacci | 0.001719 | 0.001934 | 0.002066 | 0.002280 | 0.002495 | 0.002627 | 0.002841 |
Numerical data
The following is the status of the technical indicators and moving averages at the time of publication of this technical analysis:
| RSI (14): | 38.20 | |
| MACD (12,26,9): | -0.0006 | |
| Directional Movement: | -1.494086 | |
| AROON (14): | -71.428571 | |
| DEMA (21): | 0.001713 | |
| Parabolic SAR (0,02-0,02-0,2): | 0.003446 | |
| Elder Ray (13): | -0.000254 | |
| Super Trend (3,10): | 0.001308 | |
| Zig ZAG (10): | 0.002206 | |
| VORTEX (21): | 1.0050 | |
| Stochastique (14,3,5): | 10.33 | |
| TEMA (21): | 0.003238 | |
| Williams %R (14): | -88.10 | |
| Chande Momentum Oscillator (20): | -0.000672 | |
| Repulse (5,40,3): | -3.9851 | |
| ROCnROLL: | 2 | |
| TRIX (15,9): | -1.9824 | |
| Courbe Coppock: | 42.89 |
| MA7: | 0.002184 | |
| MA20: | 0.002205 | |
| MA50: | 0.002391 | |
| MA100: | 0.002618 | |
| MAexp7: | 0.002316 | |
| MAexp20: | 0.002652 | |
| MAexp50: | 0.011007 | |
| MAexp100: | 0.041220 | |
| Price / MA7: | +0.96% | |
| Price / MA20: | -0% | |
| Price / MA50: | -7.78% | |
| Price / MA100: | -15.78% | |
| Price / MAexp7: | -4.79% | |
| Price / MAexp20: | -16.86% | |
| Price / MAexp50: | -79.97% | |
| Price / MAexp100: | -94.65% |
About author

Online


Add a comment
Comments
0 comments on the analysis SMOOTH LOVE POTION - SLP/USDT - Weekly