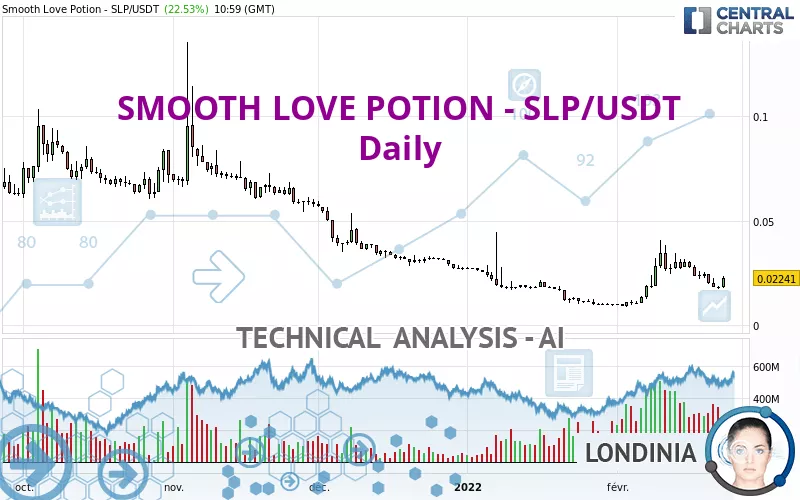
SMOOTH LOVE POTION - SLP/USDT - Daily - Technical analysis published on 02/23/2022 (GMT)
- 252
- 0
Click here for a new analysis!
- Timeframe : Daily
- - Analysis generated on
- Status : TARGET REACHED

Summary of the analysis

Additional analysis
Quotes
The SMOOTH LOVE POTION - SLP/USDT rating is 0.022410 USDT. The price registered an increase of +22.53% on the session with the lowest point at 0.017900 USDT and the highest point at 0.023490 USDT. The deviation from the price is +25.20% for the low point and -4.60% for the high point.A bearish opening was detected by the Central Gaps scanner. Sellers are trying to impose a bearish trend in the very short term.
Bearish opening
Type : Bearish
Timeframe : Openning
So that you have an overall view of the price change, here is a table showing the variations over several periods:
Abnormal volumes
Timeframe : 5 days
Abnormal volumes
Timeframe : 20 days
Abnormal volumes
Timeframe : 50 days
Technical
A technical analysis in Daily of this SMOOTH LOVE POTION - SLP/USDT chart shows a bearish trend. The signals given by moving averages are 67.86% bearish. This bearish trend could slow down given the neutral signals currently being given by short-term moving averages. The Central Indicators market scanner is currently detecting a bullish signal that could impact this trend:
Bullish price crossover with Moving Average 50
Type : Bullish
Timeframe : Daily
The technical indicators are generally neutral. They do not provide relevant information on the direction of future price movements.
Central Indicators, the scanner specialised in technical indicators, has identified these signals:
Pivot points : price is over resistance 3
Type : Neutral
Timeframe : Daily
RSI indicator is back over 50
Type : Bullish
Timeframe : Daily
The analysis of the price chart with Central Patterns scanners does not return any result.
For a small rebound in the very short term, the Central Candlesticks scanner currently notes the presence of this bullish pattern in Japanese candlesticks:
Bullish engulfing lines
Type : Bullish
Timeframe : Daily
| S1 | Price | R1 | R2 | R3 | |
|---|---|---|---|---|---|
| ProTrendLines | 0.009393 | 0.022410 | 0.058776 | 0.095765 | 0.139600 |
| Change (%) | -58.09% | - | +162.28% | +327.33% | +522.94% |
| Change | -0.013017 | - | +0.036366 | +0.073355 | +0.117190 |
| Level | Intermediate | - | Intermediate | Major | Minor |
Attention could also be paid to pivot points to set price objectives:
| Pivot points | S3 | S2 | S1 | PP | R1 | R2 | R3 |
|---|---|---|---|---|---|---|---|
| Standard | 0.015727 | 0.016483 | 0.017387 | 0.018143 | 0.019047 | 0.019803 | 0.020707 |
| Camarilla | 0.017834 | 0.017986 | 0.018138 | 0.018290 | 0.018442 | 0.018594 | 0.018747 |
| Woodie | 0.015800 | 0.016520 | 0.017460 | 0.018180 | 0.019120 | 0.019840 | 0.020780 |
| Fibonacci | 0.016483 | 0.017118 | 0.017509 | 0.018143 | 0.018778 | 0.019169 | 0.019803 |
| Pivot points | S3 | S2 | S1 | PP | R1 | R2 | R3 |
|---|---|---|---|---|---|---|---|
| Standard | 0.006707 | 0.014363 | 0.019387 | 0.027043 | 0.032067 | 0.039723 | 0.044747 |
| Camarilla | 0.020923 | 0.022085 | 0.023248 | 0.024410 | 0.025572 | 0.026735 | 0.027897 |
| Woodie | 0.005390 | 0.013705 | 0.018070 | 0.026385 | 0.030750 | 0.039065 | 0.043430 |
| Fibonacci | 0.014363 | 0.019207 | 0.022200 | 0.027043 | 0.031887 | 0.034880 | 0.039723 |
| Pivot points | S3 | S2 | S1 | PP | R1 | R2 | R3 |
|---|---|---|---|---|---|---|---|
| Standard | -0.037080 | -0.013839 | -0.001973 | 0.021268 | 0.033134 | 0.056375 | 0.068241 |
| Camarilla | 0.000238 | 0.003456 | 0.006674 | 0.009892 | 0.013110 | 0.016328 | 0.019546 |
| Woodie | -0.042769 | -0.016683 | -0.007662 | 0.018424 | 0.027446 | 0.053531 | 0.062553 |
| Fibonacci | -0.013839 | -0.000428 | 0.007858 | 0.021268 | 0.034679 | 0.042965 | 0.056375 |
Numerical data
The following is the status of technical indicators and moving averages registered at the time this technical analysis was created:
| RSI (14): | 51.77 | |
| MACD (12,26,9): | 0.0009 | |
| Directional Movement: | 12.141116 | |
| AROON (14): | -85.714286 | |
| DEMA (21): | 0.023303 | |
| Parabolic SAR (0,02-0,02-0,2): | 0.034226 | |
| Elder Ray (13): | -0.001626 | |
| Super Trend (3,10): | 0.031599 | |
| Zig ZAG (10): | 0.022500 | |
| VORTEX (21): | 1.0752 | |
| Stochastique (14,3,5): | 9.90 | |
| TEMA (21): | 0.024383 | |
| Williams %R (14): | -77.04 | |
| Chande Momentum Oscillator (20): | -0.004580 | |
| Repulse (5,40,3): | 4.4148 | |
| ROCnROLL: | -1 | |
| TRIX (15,9): | 1.6450 | |
| Courbe Coppock: | 66.88 |
| MA7: | 0.021596 | |
| MA20: | 0.022883 | |
| MA50: | 0.018306 | |
| MA100: | 0.030871 | |
| MAexp7: | 0.021811 | |
| MAexp20: | 0.021800 | |
| MAexp50: | 0.022836 | |
| MAexp100: | 0.035813 | |
| Price / MA7: | +3.77% | |
| Price / MA20: | -2.07% | |
| Price / MA50: | +22.42% | |
| Price / MA100: | -27.41% | |
| Price / MAexp7: | +2.75% | |
| Price / MAexp20: | +2.80% | |
| Price / MAexp50: | -1.87% | |
| Price / MAexp100: | -37.42% |
About author

Online


Add a comment
Comments
0 comments on the analysis SMOOTH LOVE POTION - SLP/USDT - Daily