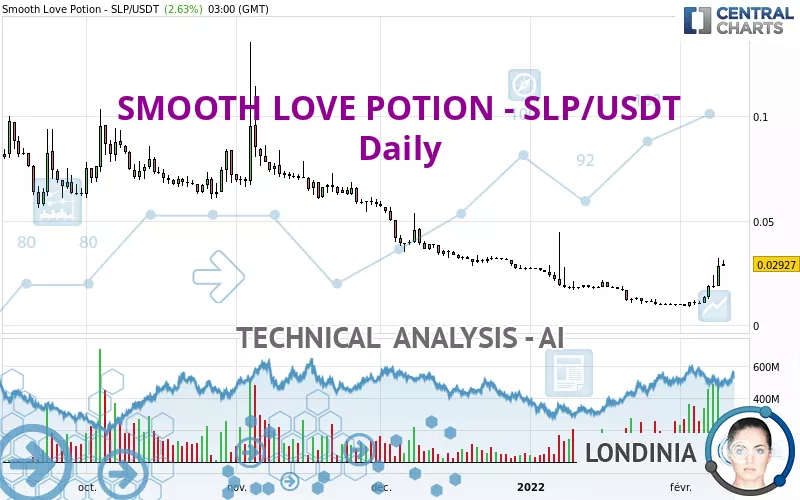
SMOOTH LOVE POTION - SLP/USDT - Daily - Technical analysis published on 02/10/2022 (GMT)
- 239
- 0
Click here for a new analysis!
- Timeframe : Daily
- - Analysis generated on
- Status : INVALID

Summary of the analysis

Additional analysis
Quotes
The SMOOTH LOVE POTION - SLP/USDT price is 0.029270 USDT. The price has increased by +2.63% since the last closing and was between 0.028510 USDT and 0.031310 USDT. This implies that the price is at +2.67% from its lowest and at -6.52% from its highest.The Central Gaps scanner detects a bearish opening. A small advantage for sellers in the very short term.
Bearish opening
Type : Bearish
Timeframe : Openning
A study of price movements over other periods shows the following variations:
Near a new HIGH record (1 month)
Type : Bullish
Timeframe : Weekly
Abnormal volumes on SMOOTH LOVE POTION - SLP/USDT were detected by the Central Volumes scanner:
Abnormal volumes
Timeframe : 5 days
Abnormal volumes
Timeframe : 20 days
Technical
Technical analysis of this Daily chart of SMOOTH LOVE POTION - SLP/USDT indicates that the overall trend is slightly bearish. Only 57.14% of the signals given by moving averages are bearish. This slightly bearish trend could quickly be reversed due to the strong bullish signals currently being given by short-term moving averages. An assessment of moving averages reveals a bullish signal that could impact this trend:
Bullish trend reversal : adaptative moving average 50
Type : Bullish
Timeframe : Daily
The probability of a further increase is high given the direction of the technical indicators.
Caution: the Central Indicators scanner currently detects an excess:
RSI indicator is overbought : over 70
Type : Neutral
Timeframe : Daily
CCI indicator is overbought : over 100
Type : Neutral
Timeframe : Daily
Previous candle closed over Bollinger bands
Type : Neutral
Timeframe : Daily
Williams %R indicator is overbought : over -20
Type : Neutral
Timeframe : Daily
Pivot points : price is over resistance 3
Type : Neutral
Timeframe : Weekly
The Central Patterns scanner, which studies chart patterns, resistances and supports, has identified this signal:
Horizontal resistance is broken
Type : Bullish
Timeframe : Daily
No result was found by the Central Candlesticks scanner on Japanese candlesticks.
| S1 | Price | R1 | R2 | R3 | |
|---|---|---|---|---|---|
| ProTrendLines | 0.020324 | 0.029270 | 0.095765 | 0.139600 | 0.210200 |
| Change (%) | -30.56% | - | +227.18% | +376.94% | +618.14% |
| Change | -0.008946 | - | +0.066495 | +0.110330 | +0.180930 |
| Level | Intermediate | - | Major | Minor | Minor |
To determine price objectives, it is also possible to use the pivot points. Here is the price position in relation to pivot points:
| Pivot points | S3 | S2 | S1 | PP | R1 | R2 | R3 |
|---|---|---|---|---|---|---|---|
| Standard | 0.006970 | 0.012800 | 0.020660 | 0.026490 | 0.034350 | 0.040180 | 0.048040 |
| Camarilla | 0.024755 | 0.026010 | 0.027265 | 0.028520 | 0.029775 | 0.031030 | 0.032285 |
| Woodie | 0.007985 | 0.013308 | 0.021675 | 0.026998 | 0.035365 | 0.040688 | 0.049055 |
| Fibonacci | 0.012800 | 0.018030 | 0.021260 | 0.026490 | 0.031720 | 0.034950 | 0.040180 |
| Pivot points | S3 | S2 | S1 | PP | R1 | R2 | R3 |
|---|---|---|---|---|---|---|---|
| Standard | 0.005222 | 0.006973 | 0.008837 | 0.010588 | 0.012452 | 0.014203 | 0.016067 |
| Camarilla | 0.009706 | 0.010037 | 0.010369 | 0.010700 | 0.011031 | 0.011363 | 0.011694 |
| Woodie | 0.005278 | 0.007001 | 0.008893 | 0.010616 | 0.012508 | 0.014231 | 0.016123 |
| Fibonacci | 0.006973 | 0.008354 | 0.009207 | 0.010588 | 0.011969 | 0.012822 | 0.014203 |
| Pivot points | S3 | S2 | S1 | PP | R1 | R2 | R3 |
|---|---|---|---|---|---|---|---|
| Standard | -0.037080 | -0.013839 | -0.001973 | 0.021268 | 0.033134 | 0.056375 | 0.068241 |
| Camarilla | 0.000238 | 0.003456 | 0.006674 | 0.009892 | 0.013110 | 0.016328 | 0.019546 |
| Woodie | -0.042769 | -0.016683 | -0.007662 | 0.018424 | 0.027446 | 0.053531 | 0.062553 |
| Fibonacci | -0.013839 | -0.000428 | 0.007858 | 0.021268 | 0.034679 | 0.042965 | 0.056375 |
Numerical data
The following is the status of the technical indicators and moving averages at the time of publication of this technical analysis:
| RSI (14): | 79.31 | |
| MACD (12,26,9): | 0.0011 | |
| Directional Movement: | 38.019893 | |
| AROON (14): | 42.857143 | |
| DEMA (21): | 0.016681 | |
| Parabolic SAR (0,02-0,02-0,2): | 0.012930 | |
| Elder Ray (13): | 0.012246 | |
| Super Trend (3,10): | 0.018666 | |
| Zig ZAG (10): | 0.029620 | |
| VORTEX (21): | 1.1982 | |
| Stochastique (14,3,5): | 79.68 | |
| TEMA (21): | 0.021309 | |
| Williams %R (14): | -10.21 | |
| Chande Momentum Oscillator (20): | 0.019610 | |
| Repulse (5,40,3): | 38.0986 | |
| ROCnROLL: | 1 | |
| TRIX (15,9): | -1.4716 | |
| Courbe Coppock: | 154.60 |
| MA7: | 0.018694 | |
| MA20: | 0.013606 | |
| MA50: | 0.019294 | |
| MA100: | 0.037488 | |
| MAexp7: | 0.021000 | |
| MAexp20: | 0.016657 | |
| MAexp50: | 0.021663 | |
| MAexp100: | 0.038384 | |
| Price / MA7: | +56.57% | |
| Price / MA20: | +115.13% | |
| Price / MA50: | +51.71% | |
| Price / MA100: | -21.92% | |
| Price / MAexp7: | +39.38% | |
| Price / MAexp20: | +75.72% | |
| Price / MAexp50: | +35.12% | |
| Price / MAexp100: | -23.74% |
About author

Online


Add a comment
Comments
0 comments on the analysis SMOOTH LOVE POTION - SLP/USDT - Daily