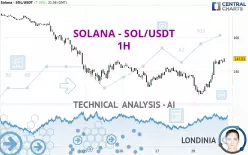
SOLANA - SOL/USDT - 1H - Technical analysis published on 02/28/2025 (GMT)
- 837
- 0
Click here for a new analysis!
- Timeframe : 1H
- - Analysis generated on
- Status : INVALID

Summary of the analysis

Additional analysis
Quotes
The SOLANA - SOL/USDT price is 147.53 USDT. The price has increased by +7.10% since the last closing and was traded between 125.90 USDT and 147.53 USDT over the period. The price is currently at +17.18% from its lowest and 0% from its highest.The Central Gaps scanner detects a bullish opening marking the presence of buyers ahead of sellers at the opening but not sufficiently marked to allow the price to register a quotation gap.
Bullish opening
Type : Bullish
Timeframe : Openning
Here is a more detailed summary of the historical variations registered by SOLANA - SOL/USDT:
New LOW record (1st january)
Type : Bearish
Timeframe : Weekly
New LOW record (1 month)
Type : Bearish
Timeframe : Weekly
Technical
A technical analysis in 1H of this SOLANA - SOL/USDT chart shows a bullish trend. 64.29% of the signals given by moving averages are bullish. This bullish trend is supported by the strong bullish signals given by short-term moving averages. The Central Indicators scanner does not detect any result on moving averages that would impact this trend.
In fact, 16 technical indicators on 18 studied are currently positioned bullish. But beware of excesses. The Central Indicators scanner currently detects this:
Williams %R indicator is overbought : over -20
Type : Neutral
Timeframe : 1 hour
Pivot points : price is over resistance 2
Type : Neutral
Timeframe : 1 hour
Pivot points : price is under support 3
Type : Neutral
Timeframe : Weekly
The analysis of the price chart with Central Patterns scanners does not return any result.
Central Candlesticks, the scanner specialised in Japanese candlesticks, detects these bullish signals that could support the hypothesis of a small rebound in the very short term:
Bullish harami
Type : Bullish
Timeframe : 1 hour
Bullish harami cross
Type : Bullish
Timeframe : 1 hour
| S3 | S2 | S1 | Price | R1 | R2 | R3 | |
|---|---|---|---|---|---|---|---|
| ProTrendLines | 125.38 | 132.59 | 142.24 | 147.53 | 158.14 | 167.49 | 180.12 |
| Change (%) | -15.01% | -10.13% | -3.59% | - | +7.19% | +13.53% | +22.09% |
| Change | -22.15 | -14.94 | -5.29 | - | +10.61 | +19.96 | +32.59 |
| Level | Major | Intermediate | Intermediate | - | Intermediate | Intermediate | Major |
Attention could also be paid to pivot points to set price objectives:
| Pivot points | S3 | S2 | S1 | PP | R1 | R2 | R3 |
|---|---|---|---|---|---|---|---|
| Standard | 127.16 | 131.08 | 134.42 | 138.34 | 141.68 | 145.60 | 148.94 |
| Camarilla | 135.75 | 136.42 | 137.09 | 137.75 | 138.42 | 139.08 | 139.75 |
| Woodie | 126.86 | 130.94 | 134.12 | 138.20 | 141.38 | 145.46 | 148.64 |
| Fibonacci | 131.08 | 133.86 | 135.57 | 138.34 | 141.12 | 142.83 | 145.60 |
| Pivot points | S3 | S2 | S1 | PP | R1 | R2 | R3 |
|---|---|---|---|---|---|---|---|
| Standard | 122.41 | 141.89 | 157.03 | 176.51 | 191.65 | 211.13 | 226.27 |
| Camarilla | 162.64 | 165.81 | 168.99 | 172.16 | 175.33 | 178.51 | 181.68 |
| Woodie | 120.23 | 140.81 | 154.85 | 175.43 | 189.47 | 210.05 | 224.09 |
| Fibonacci | 141.89 | 155.12 | 163.29 | 176.51 | 189.74 | 197.91 | 211.13 |
| Pivot points | S3 | S2 | S1 | PP | R1 | R2 | R3 |
|---|---|---|---|---|---|---|---|
| Standard | 47.34 | 109.43 | 170.51 | 232.60 | 293.68 | 355.77 | 416.85 |
| Camarilla | 197.72 | 209.01 | 220.30 | 231.59 | 242.88 | 254.17 | 265.46 |
| Woodie | 46.84 | 109.18 | 170.01 | 232.35 | 293.18 | 355.52 | 416.35 |
| Fibonacci | 109.43 | 156.48 | 185.55 | 232.60 | 279.65 | 308.72 | 355.77 |
Numerical data
The following is the status of technical indicators and moving averages registered at the time this technical analysis was created:
| RSI (14): | 67.14 | |
| MACD (12,26,9): | 2.9600 | |
| Directional Movement: | 21.24 | |
| AROON (14): | 92.86 | |
| DEMA (21): | 142.63 | |
| Parabolic SAR (0,02-0,02-0,2): | 139.63 | |
| Elder Ray (13): | 4.78 | |
| Super Trend (3,10): | 138.86 | |
| Zig ZAG (10): | 145.87 | |
| VORTEX (21): | 1.1400 | |
| Stochastique (14,3,5): | 95.72 | |
| TEMA (21): | 145.91 | |
| Williams %R (14): | -9.16 | |
| Chande Momentum Oscillator (20): | 14.33 | |
| Repulse (5,40,3): | 0.1500 | |
| ROCnROLL: | 1 | |
| TRIX (15,9): | 0.1200 | |
| Courbe Coppock: | 23.24 |
| MA7: | 149.16 | |
| MA20: | 173.93 | |
| MA50: | 201.93 | |
| MA100: | 209.41 | |
| MAexp7: | 144.04 | |
| MAexp20: | 139.65 | |
| MAexp50: | 138.56 | |
| MAexp100: | 142.26 | |
| Price / MA7: | -1.09% | |
| Price / MA20: | -15.18% | |
| Price / MA50: | -26.94% | |
| Price / MA100: | -29.55% | |
| Price / MAexp7: | +2.42% | |
| Price / MAexp20: | +5.64% | |
| Price / MAexp50: | +6.47% | |
| Price / MAexp100: | +3.70% |
About author

Online


Add a comment
Comments
0 comments on the analysis SOLANA - SOL/USDT - 1H