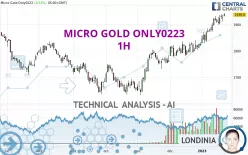
MICRO GOLD ONLY0223 - 1H - Technical analysis published on 01/24/2023 (GMT)
- 129
- 0
Click here for a new analysis!
- Timeframe : 1H
- - Analysis generated on
- Status : LEVEL MAINTAINED

Summary of the analysis
Additional analysis
Quotes
MICRO GOLD ONLY0223 rating 1,938.8 USD. On the day, this instrument gained +0.53% and was traded between 1,931.5 USD and 1,943.8 USD over the period. The price is currently at +0.38% from its lowest and -0.26% from its highest.The Central Gaps scanner detects a bullish opening. A small advantage for buyers in the very short term.
Bullish opening
Type : Bullish
Timeframe : Openning
Here is a more detailed summary of the historical variations registered by MICRO GOLD ONLY0223:
New HIGH record (1st january)
Type : Bullish
Timeframe : Weekly
New HIGH record (1 month)
Type : Bullish
Timeframe : Weekly
The Central Volumes scanner notes the presence of abnormal volumes:
Abnormal volumes
Timeframe : 5 days
Abnormal volumes
Timeframe : 20 days
Abnormal volumes
Timeframe : 50 days
Technical
Technical analysis of MICRO GOLD ONLY0223 in 1H shows a strongly overall bullish trend. 92.86% of the signals given by moving averages are bullish. The overall trend is supported by the strong bullish signals from short-term moving averages. The Central Indicators market scanner currently does not detect any result that concerns moving averages.
In fact, 10 technical indicators on 18 studied are currently positioned bullish. But beware of excesses. The Central Indicators scanner currently detects this:
MACD indicator: bearish divergence
Type : Bearish
Timeframe : 1 hour
Williams %R indicator is back under -50
Type : Bearish
Timeframe : 1 hour
No signals are given by Central Patterns, a market scanner specialised in chart patterns, resistances and supports.
For a small rebound in the very short term, the Central Candlesticks scanner currently notes the presence of these bullish patterns in Japanese candlesticks:
Bullish harami
Type : Bullish
Timeframe : 1 hour
Bullish harami cross
Type : Bullish
Timeframe : 1 hour
| S3 | S2 | S1 | Price | R1 | R2 | |
|---|---|---|---|---|---|---|
| ProTrendLines | 1,905.2 | 1,912.5 | 1,936.7 | 1,938.8 | 1,943.7 | 2,017.0 |
| Change (%) | -1.73% | -1.36% | -0.11% | - | +0.25% | +4.03% |
| Change | -33.6 | -26.3 | -2.1 | - | +4.9 | +78.2 |
| Level | Minor | Intermediate | Intermediate | - | Minor | Intermediate |
To determine price objectives, it is also possible to use the pivot points. Here is the price position in relation to pivot points:
| Pivot points | S3 | S2 | S1 | PP | R1 | R2 | R3 |
|---|---|---|---|---|---|---|---|
| Standard | 1,890.9 | 1,901.7 | 1,915.1 | 1,925.9 | 1,939.3 | 1,950.1 | 1,963.5 |
| Camarilla | 1,922.0 | 1,924.2 | 1,926.4 | 1,928.6 | 1,930.8 | 1,933.0 | 1,935.3 |
| Woodie | 1,892.3 | 1,902.4 | 1,916.5 | 1,926.6 | 1,940.7 | 1,950.8 | 1,964.9 |
| Fibonacci | 1,901.7 | 1,910.9 | 1,916.6 | 1,925.9 | 1,935.1 | 1,940.8 | 1,950.1 |
| Pivot points | S3 | S2 | S1 | PP | R1 | R2 | R3 |
|---|---|---|---|---|---|---|---|
| Standard | 1,864.5 | 1,881.5 | 1,904.9 | 1,921.9 | 1,945.3 | 1,962.3 | 1,985.7 |
| Camarilla | 1,917.1 | 1,920.8 | 1,924.5 | 1,928.2 | 1,931.9 | 1,935.6 | 1,939.3 |
| Woodie | 1,867.6 | 1,883.1 | 1,908.0 | 1,923.5 | 1,948.4 | 1,963.9 | 1,988.8 |
| Fibonacci | 1,881.5 | 1,897.0 | 1,906.5 | 1,921.9 | 1,937.4 | 1,946.9 | 1,962.3 |
| Pivot points | S3 | S2 | S1 | PP | R1 | R2 | R3 |
|---|---|---|---|---|---|---|---|
| Standard | 1,724.5 | 1,751.1 | 1,788.7 | 1,815.3 | 1,852.9 | 1,879.5 | 1,917.1 |
| Camarilla | 1,808.6 | 1,814.4 | 1,820.3 | 1,826.2 | 1,832.1 | 1,838.0 | 1,843.9 |
| Woodie | 1,729.9 | 1,753.9 | 1,794.1 | 1,818.1 | 1,858.3 | 1,882.3 | 1,922.5 |
| Fibonacci | 1,751.1 | 1,775.7 | 1,790.8 | 1,815.3 | 1,839.9 | 1,855.0 | 1,879.5 |
Numerical data
The following is the status of technical indicators and moving averages registered at the time this technical analysis was created:
| RSI (14): | 60.20 | |
| MACD (12,26,9): | 3.1000 | |
| Directional Movement: | 8.4 | |
| AROON (14): | 78.6 | |
| DEMA (21): | 1,938.6 | |
| Parabolic SAR (0,02-0,02-0,2): | 1,943.6 | |
| Elder Ray (13): | 1.2 | |
| Super Trend (3,10): | 1,928.4 | |
| Zig ZAG (10): | 1,939.1 | |
| VORTEX (21): | 1.2000 | |
| Stochastique (14,3,5): | 65.20 | |
| TEMA (21): | 1,940.4 | |
| Williams %R (14): | -42.30 | |
| Chande Momentum Oscillator (20): | 7.0 | |
| Repulse (5,40,3): | 0.1000 | |
| ROCnROLL: | 1 | |
| TRIX (15,9): | 0.0000 | |
| Courbe Coppock: | 0.90 |
| MA7: | 1,922.1 | |
| MA20: | 1,880.7 | |
| MA50: | 1,825.9 | |
| MA100: | 1,761.2 | |
| MAexp7: | 1,938.3 | |
| MAexp20: | 1,934.9 | |
| MAexp50: | 1,930.5 | |
| MAexp100: | 1,924.9 | |
| Price / MA7: | +0.87% | |
| Price / MA20: | +3.09% | |
| Price / MA50: | +6.18% | |
| Price / MA100: | +10.08% | |
| Price / MAexp7: | +0.03% | |
| Price / MAexp20: | +0.20% | |
| Price / MAexp50: | +0.43% | |
| Price / MAexp100: | +0.72% |
About author

Online


Add a comment
Comments
0 comments on the analysis MICRO GOLD ONLY0223 - 1H