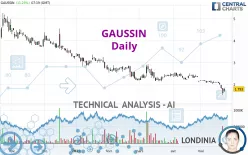
GAUSSIN - Daily - Technical analysis published on 05/24/2023 (GMT)
- 231
- 0
Click here for a new analysis!
- Timeframe : Daily
- - Analysis generated on
- Status : INVALID

Summary of the analysis
Additional analysis
Quotes
The GAUSSIN rating is 1.793 EUR. On the day, this instrument gained +11.23% and was traded between 1.667 EUR and 1.850 EUR over the period. The price is currently at +7.56% from its lowest and -3.08% from its highest.The Central Gaps scanner detects a bullish opening marking the presence of buyers ahead of sellers at the opening but not sufficiently marked to allow the price to register a quotation gap.
Bullish opening
Type : Bullish
Timeframe : Openning
Here is a more detailed summary of the historical variations registered by GAUSSIN:
Technical
Technical analysis of this Daily chart of GAUSSIN indicates that the overall trend is strongly bearish. 92.86% of the signals given by moving averages are bearish. The overall trend is supported by the strong bearish signals from short-term moving averages. The Central Indicators scanner does not detect any result on moving averages that would impact this trend.
In fact, according to the parameters integrated into the Central Analyzer system, 10 technical indicators out of 18 analysed are currently bearish. Caution: the Central Indicators scanner currently detects an excess:
CCI indicator is oversold : under -100
Type : Neutral
Timeframe : Daily
Previous candle closed under Bollinger bands
Type : Neutral
Timeframe : Daily
Pivot points : price is over resistance 1
Type : Neutral
Timeframe : Daily
Pivot points : price is under support 3
Type : Neutral
Timeframe : Weekly
No signals are given by Central Patterns, a market scanner specialised in chart patterns, resistances and supports.
Central Candlesticks, the scanner specialised in Japanese candlesticks, detects a bullish signal that could support the hypothesis of a small rebound in the very short term:
Bullish harami
Type : Bullish
Timeframe : Daily
| S1 | Price | R1 | R2 | R3 | |
|---|---|---|---|---|---|
| ProTrendLines | 1.035 | 1.793 | 2.185 | 2.814 | 3.350 |
| Change (%) | -42.28% | - | +21.86% | +56.94% | +86.84% |
| Change | -0.758 | - | +0.392 | +1.021 | +1.557 |
| Level | Intermediate | - | Intermediate | Minor | Minor |
Attention could also be paid to pivot points to set price objectives:
| Pivot points | S3 | S2 | S1 | PP | R1 | R2 | R3 |
|---|---|---|---|---|---|---|---|
| Standard | 1.151 | 1.331 | 1.471 | 1.651 | 1.791 | 1.971 | 2.111 |
| Camarilla | 1.524 | 1.553 | 1.583 | 1.612 | 1.641 | 1.671 | 1.700 |
| Woodie | 1.132 | 1.321 | 1.452 | 1.641 | 1.772 | 1.961 | 2.092 |
| Fibonacci | 1.331 | 1.453 | 1.528 | 1.651 | 1.773 | 1.848 | 1.971 |
| Pivot points | S3 | S2 | S1 | PP | R1 | R2 | R3 |
|---|---|---|---|---|---|---|---|
| Standard | 1.780 | 1.886 | 1.948 | 2.054 | 2.116 | 2.222 | 2.284 |
| Camarilla | 1.964 | 1.979 | 1.995 | 2.010 | 2.025 | 2.041 | 2.056 |
| Woodie | 1.758 | 1.875 | 1.926 | 2.043 | 2.094 | 2.211 | 2.262 |
| Fibonacci | 1.886 | 1.950 | 1.990 | 2.054 | 2.118 | 2.158 | 2.222 |
| Pivot points | S3 | S2 | S1 | PP | R1 | R2 | R3 |
|---|---|---|---|---|---|---|---|
| Standard | 1.509 | 1.805 | 1.983 | 2.279 | 2.457 | 2.753 | 2.931 |
| Camarilla | 2.032 | 2.075 | 2.119 | 2.162 | 2.206 | 2.249 | 2.292 |
| Woodie | 1.451 | 1.776 | 1.925 | 2.250 | 2.399 | 2.724 | 2.873 |
| Fibonacci | 1.805 | 1.986 | 2.098 | 2.279 | 2.460 | 2.572 | 2.753 |
Numerical data
The following is the status of technical indicators and moving averages registered at the time this technical analysis was created:
| RSI (14): | 34.32 | |
| MACD (12,26,9): | -0.1300 | |
| Directional Movement: | -35.661 | |
| AROON (14): | -85.714 | |
| DEMA (21): | 1.899 | |
| Parabolic SAR (0,02-0,02-0,2): | 2.173 | |
| Elder Ray (13): | -0.227 | |
| Super Trend (3,10): | 2.011 | |
| Zig ZAG (10): | 1.791 | |
| VORTEX (21): | 0.7190 | |
| Stochastique (14,3,5): | 23.02 | |
| TEMA (21): | 1.830 | |
| Williams %R (14): | -54.69 | |
| Chande Momentum Oscillator (20): | -0.290 | |
| Repulse (5,40,3): | -5.2410 | |
| ROCnROLL: | 2 | |
| TRIX (15,9): | -0.5910 | |
| Courbe Coppock: | 27.06 |
| MA7: | 1.933 | |
| MA20: | 2.088 | |
| MA50: | 2.251 | |
| MA100: | 2.519 | |
| MAexp7: | 1.889 | |
| MAexp20: | 2.056 | |
| MAexp50: | 2.255 | |
| MAexp100: | 2.571 | |
| Price / MA7: | -7.24% | |
| Price / MA20: | -14.13% | |
| Price / MA50: | -20.35% | |
| Price / MA100: | -28.82% | |
| Price / MAexp7: | -5.08% | |
| Price / MAexp20: | -12.79% | |
| Price / MAexp50: | -20.49% | |
| Price / MAexp100: | -30.26% |
News
Don't forget to follow the news on GAUSSIN. At the time of publication of this analysis, the latest news was as follows:
- RiverFort Group participates in a €5m advance on a Term Loan Facility With Gaussin SA (ALGAU)
- CHARBONE HYDROGEN Announces the Termination of the Term Sheet With GAUSSIN
- GAUSSIN to Present at the Roth Capital Partners 8th Annual London Conference
- CHARBONE Hydrogen Announces the Execution of a Term Sheet With GAUSSIN to Manufacture and Commercialize Hydrogen Vehicles in Canada
- The GAUSSIN Group and Its European Distributor BLYYD Announce That the ATM 38T FULL ELEC Has Passed the One Million Kilometer Mark
About author

Online


Add a comment
Comments
0 comments on the analysis GAUSSIN - Daily