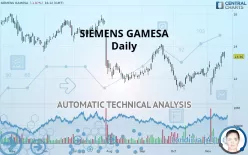
SIEMENS GAMESA - Daily - Technical analysis published on 11/18/2019 (GMT)
- 331
- 0
- Who voted?
Click here for a new analysis!
- Timeframe : Daily
- - Analysis generated on
- Status : INVALID

Summary of the analysis
Additional analysis
Quotes
The SIEMENS GAMESA price is 13.360 EUR. The price is lower by -1.87% since the last closing and was between 13.220 EUR and 13.700 EUR. This implies that the price is at +1.06% from its lowest and at -2.48% from its highest.The Central Gaps scanner detects a bullish gap which is a sign that buyers have taken the lead in the very short term.
Opening Gap UP
Type : Bullish
Timeframe : Openning
Here is a more detailed summary of the historical variations registered by SIEMENS GAMESA:
Technical
A technical analysis in Daily of this SIEMENS GAMESA chart shows a bullish trend. The signals returned by the moving averages are 64.29% bullish. This bullish trend is reinforced by the strong signals currently being given by short-term moving averages. The Central Indicators scanner does not detect any result on moving averages that would impact this trend.
In fact, according to the parameters integrated into the Central Analyzer system, 13 technical indicators out of 18 analysed are currently bullish. Caution: the Central Indicators scanner currently detects an excess:
CCI indicator is overbought : over 100
Type : Neutral
Timeframe : Daily
Williams %R indicator is overbought : over -20
Type : Neutral
Timeframe : Daily
Pivot points : price is under support 1
Type : Neutral
Timeframe : Daily
Price is back over the pivot point
Type : Bullish
Timeframe : Daily
Price is back over the pivot point
Type : Bullish
Timeframe : Weekly
Central Patterns, the market scanner focusing on chart patterns, resistances and supports found these results:
Near horizontal resistance
Type : Bearish
Timeframe : Daily
Resistance of channel is broken
Type : Bullish
Timeframe : Daily
The Central Candlesticks scanner, specialised in Japanese candlesticks, did not identify any signals.
| S3 | S2 | S1 | Price | R1 | R2 | R3 | |
|---|---|---|---|---|---|---|---|
| ProTrendLines | 11.495 | 11.900 | 13.050 | 13.360 | 14.425 | 14.772 | 15.205 |
| Change (%) | -13.96% | -10.93% | -2.32% | - | +7.97% | +10.57% | +13.81% |
| Change | -1.865 | -1.460 | -0.310 | - | +1.065 | +1.412 | +1.845 |
| Level | Intermediate | Intermediate | Intermediate | - | Intermediate | Minor | Minor |
Pivot points can also be used to set your price objectives. Here is the price situation in relation to pivot points:
| Pivot points | S3 | S2 | S1 | PP | R1 | R2 | R3 |
|---|---|---|---|---|---|---|---|
| Standard | 13.120 | 13.225 | 13.420 | 13.525 | 13.720 | 13.825 | 14.020 |
| Camarilla | 13.533 | 13.560 | 13.588 | 13.615 | 13.643 | 13.670 | 13.698 |
| Woodie | 13.165 | 13.248 | 13.465 | 13.548 | 13.765 | 13.848 | 14.065 |
| Fibonacci | 13.225 | 13.340 | 13.410 | 13.525 | 13.640 | 13.710 | 13.825 |
| Pivot points | S3 | S2 | S1 | PP | R1 | R2 | R3 |
|---|---|---|---|---|---|---|---|
| Standard | 11.820 | 12.185 | 12.900 | 13.265 | 13.980 | 14.345 | 15.060 |
| Camarilla | 13.318 | 13.417 | 13.516 | 13.615 | 13.714 | 13.813 | 13.912 |
| Woodie | 11.995 | 12.273 | 13.075 | 13.353 | 14.155 | 14.433 | 15.235 |
| Fibonacci | 12.185 | 12.598 | 12.852 | 13.265 | 13.678 | 13.932 | 14.345 |
| Pivot points | S3 | S2 | S1 | PP | R1 | R2 | R3 |
|---|---|---|---|---|---|---|---|
| Standard | 10.053 | 10.642 | 11.483 | 12.072 | 12.913 | 13.502 | 14.343 |
| Camarilla | 11.932 | 12.063 | 12.194 | 12.325 | 12.456 | 12.587 | 12.718 |
| Woodie | 10.180 | 10.705 | 11.610 | 12.135 | 13.040 | 13.565 | 14.470 |
| Fibonacci | 10.642 | 11.188 | 11.525 | 12.072 | 12.618 | 12.955 | 13.502 |
Numerical data
The following is the status of technical indicators and moving averages registered at the time this technical analysis was created:
| RSI (14): | 60.71 | |
| MACD (12,26,9): | 0.2460 | |
| Directional Movement: | 7.386 | |
| AROON (14): | 64.286 | |
| DEMA (21): | 12.969 | |
| Parabolic SAR (0,02-0,02-0,2): | 11.281 | |
| Elder Ray (13): | 0.591 | |
| Super Trend (3,10): | 12.111 | |
| Zig ZAG (10): | 13.345 | |
| VORTEX (21): | 1.1840 | |
| Stochastique (14,3,5): | 93.82 | |
| TEMA (21): | 13.260 | |
| Williams %R (14): | -12.36 | |
| Chande Momentum Oscillator (20): | 1.040 | |
| Repulse (5,40,3): | 2.8370 | |
| ROCnROLL: | 1 | |
| TRIX (15,9): | 0.1290 | |
| Courbe Coppock: | 11.64 |
| MA7: | 13.085 | |
| MA20: | 12.592 | |
| MA50: | 12.620 | |
| MA100: | 13.041 | |
| MAexp7: | 13.119 | |
| MAexp20: | 12.717 | |
| MAexp50: | 12.655 | |
| MAexp100: | 12.939 | |
| Price / MA7: | +2.10% | |
| Price / MA20: | +6.10% | |
| Price / MA50: | +5.86% | |
| Price / MA100: | +2.45% | |
| Price / MAexp7: | +1.84% | |
| Price / MAexp20: | +5.06% | |
| Price / MAexp50: | +5.57% | |
| Price / MAexp100: | +3.25% |
News
The latest news and videos published on SIEMENS GAMESA at the time of the analysis were as follows:
 Gamesa Corporacion Techno
About author

Online


Add a comment
Comments
0 comments on the analysis SIEMENS GAMESA - Daily