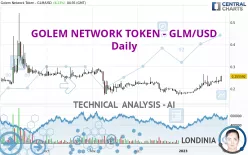
GOLEM - GLM/USD - Daily - Technical analysis published on 01/27/2023 (GMT)
- 155
- 0
Click here for a new analysis!
- Timeframe : Daily
- - Analysis generated on
- Status : TARGET REACHED

Summary of the analysis

Additional analysis
Quotes
GOLEM NETWORK TOKEN - GLM/USD rating 0.255592 USD. On the day, this instrument gained +8.23% and was traded between 0.230230 USD and 0.258100 USD over the period. The price is currently at +11.02% from its lowest and -0.97% from its highest.The Central Gaps scanner detects a bearish opening marking the presence of sellers ahead of buyers at the opening but not sufficiently marked to allow the price to register a quotation gap.
Bearish opening
Type : Bearish
Timeframe : Openning
So that you have an overall view of the price change, here is a table showing the variations over several periods:
Near a new HIGH record (1st january)
Type : Bullish
Timeframe : Weekly
Near a new HIGH record (1 month)
Type : Bullish
Timeframe : Weekly
Technical
Technical analysis of this Daily chart of GOLEM NETWORK TOKEN - GLM/USD indicates that the overall trend is bullish. The signals returned by the moving averages are 71.43% bullish. This bullish trend is reinforced by the strong signals currently being given by short-term moving averages. The Central Indicators scanner does not detect any result on moving averages that would impact this trend.
An assessment of technical indicators shows a strong bullish signal.
But beware of excesses. The Central Indicators scanner currently detects this:
RSI indicator is overbought : over 70
Type : Neutral
Timeframe : Daily
CCI indicator is overbought : over 100
Type : Neutral
Timeframe : Daily
Williams %R indicator is overbought : over -20
Type : Neutral
Timeframe : Daily
Pivot points : price is over resistance 3
Type : Neutral
Timeframe : Daily
Parabolic SAR indicator bullish reversal
Type : Bullish
Timeframe : Daily
Price is back over the pivot point
Type : Bullish
Timeframe : Weekly
Central Patterns, the scanner specializing in chart patterns, did not identify any signals.
Central Candlesticks, the scanner specialised in Japanese candlesticks, detects a bullish signal that could support the hypothesis of a small rebound in the very short term:
Bullish engulfing lines
Type : Bullish
Timeframe : Daily
| S3 | S2 | S1 | Price | R1 | R2 | R3 | |
|---|---|---|---|---|---|---|---|
| ProTrendLines | 0.080000 | 0.178059 | 0.220362 | 0.255592 | 0.304850 | 0.405378 | 0.576854 |
| Change (%) | -68.70% | -30.33% | -13.78% | - | +19.27% | +58.60% | +125.69% |
| Change | -0.175592 | -0.077533 | -0.035230 | - | +0.049258 | +0.149786 | +0.321262 |
| Level | Minor | Minor | Major | - | Minor | Intermediate | Minor |
Pivot points can also be used to set your price objectives. Here is the price situation in relation to pivot points:
| Pivot points | S3 | S2 | S1 | PP | R1 | R2 | R3 |
|---|---|---|---|---|---|---|---|
| Standard | 0.222841 | 0.226603 | 0.231377 | 0.235139 | 0.239913 | 0.243675 | 0.248449 |
| Camarilla | 0.233805 | 0.234587 | 0.235370 | 0.236152 | 0.236935 | 0.237717 | 0.238499 |
| Woodie | 0.223348 | 0.226856 | 0.231884 | 0.235392 | 0.240420 | 0.243928 | 0.248956 |
| Fibonacci | 0.226603 | 0.229863 | 0.231878 | 0.235139 | 0.238399 | 0.240414 | 0.243675 |
| Pivot points | S3 | S2 | S1 | PP | R1 | R2 | R3 |
|---|---|---|---|---|---|---|---|
| Standard | 0.150747 | 0.180699 | 0.205620 | 0.235572 | 0.260493 | 0.290445 | 0.315366 |
| Camarilla | 0.215452 | 0.220482 | 0.225512 | 0.230542 | 0.235572 | 0.240602 | 0.245632 |
| Woodie | 0.148233 | 0.179441 | 0.203106 | 0.234314 | 0.257979 | 0.289187 | 0.312852 |
| Fibonacci | 0.180699 | 0.201660 | 0.214610 | 0.235572 | 0.256533 | 0.269483 | 0.290445 |
| Pivot points | S3 | S2 | S1 | PP | R1 | R2 | R3 |
|---|---|---|---|---|---|---|---|
| Standard | 0.067196 | 0.118661 | 0.148162 | 0.199627 | 0.229128 | 0.280593 | 0.310094 |
| Camarilla | 0.155396 | 0.162818 | 0.170240 | 0.177662 | 0.185084 | 0.192506 | 0.199928 |
| Woodie | 0.056213 | 0.113170 | 0.137179 | 0.194136 | 0.218145 | 0.275102 | 0.299111 |
| Fibonacci | 0.118661 | 0.149590 | 0.168698 | 0.199627 | 0.230556 | 0.249664 | 0.280593 |
Numerical data
The following is the status of technical indicators and moving averages registered at the time this technical analysis was created:
| RSI (14): | 74.21 | |
| MACD (12,26,9): | 0.0113 | |
| Directional Movement: | 37.147143 | |
| AROON (14): | 14.285714 | |
| DEMA (21): | 0.235696 | |
| Parabolic SAR (0,02-0,02-0,2): | 0.210650 | |
| Elder Ray (13): | 0.015321 | |
| Super Trend (3,10): | 0.195073 | |
| Zig ZAG (10): | 0.254442 | |
| VORTEX (21): | 1.1469 | |
| Stochastique (14,3,5): | 62.47 | |
| TEMA (21): | 0.245306 | |
| Williams %R (14): | -21.81 | |
| Chande Momentum Oscillator (20): | 0.029147 | |
| Repulse (5,40,3): | 10.4025 | |
| ROCnROLL: | 1 | |
| TRIX (15,9): | 0.6492 | |
| Courbe Coppock: | 31.01 |
| MA7: | 0.235391 | |
| MA20: | 0.219742 | |
| MA50: | 0.205875 | |
| MA100: | 0.220146 | |
| MAexp7: | 0.236880 | |
| MAexp20: | 0.222304 | |
| MAexp50: | 0.214368 | |
| MAexp100: | 0.220785 | |
| Price / MA7: | +8.58% | |
| Price / MA20: | +16.31% | |
| Price / MA50: | +24.15% | |
| Price / MA100: | +16.10% | |
| Price / MAexp7: | +7.90% | |
| Price / MAexp20: | +14.97% | |
| Price / MAexp50: | +19.23% | |
| Price / MAexp100: | +15.77% |
About author
Online


Add a comment
Comments
0 comments on the analysis GOLEM - GLM/USD - Daily