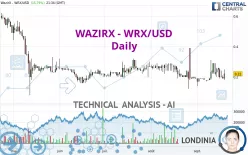
WAZIRX - WRX/USD - Daily - Technical analysis published on 09/19/2022 (GMT)
- 141
- 0
- Timeframe : Daily
- - Analysis generated on
- Status : NEUTRAL

Summary of the analysis
Additional analysis
Quotes
The WAZIRX - WRX/USD price is 0.220000 USD. The price registered an increase of +15.79% on the session and was between 0.180000 USD and 0.250000 USD. This implies that the price is at +22.22% from its lowest and at -12.00% from its highest.Here is a more detailed summary of the historical variations registered by WAZIRX - WRX/USD:
Technical
Technical analysis of this Daily chart of WAZIRX - WRX/USD indicates that the overall trend is slightly bearish. 50.00% of the signals given by moving averages are bearish. As the signals currently given by short-term moving averages are rather neutral, the slightly bearish trend could return to neutral. An assessment of moving averages reveals several bullish signals that could impact this trend:
Bullish price crossover with Moving Average 20
Type : Bullish
Timeframe : Daily
Bullish price crossover with Moving Average 50
Type : Bullish
Timeframe : Daily
Bullish price crossover with Moving Average 100
Type : Bullish
Timeframe : Daily
Bullish price crossover with adaptative moving average 20
Type : Bullish
Timeframe : Daily
Bullish price crossover with adaptative moving average 50
Type : Bullish
Timeframe : Daily
Bullish price crossover with adaptative moving average 100
Type : Bullish
Timeframe : Daily
The technical indicators are bullish. There is still some doubt about the price increase.
Central Indicators, the scanner specialised in technical indicators, has identified these signals:
Pivot points : price is over resistance 3
Type : Neutral
Timeframe : Daily
RSI indicator is back over 50
Type : Bullish
Timeframe : Daily
MACD indicator is back over 0
Type : Bullish
Timeframe : Daily
Price is back over the pivot point
Type : Bullish
Timeframe : Weekly
Williams %R indicator is back over -50
Type : Bullish
Timeframe : Daily
Central Patterns, the scanner specializing in chart patterns, did not identify any signals.
The Central Candlesticks scanner which studies Japanese candlesticks did not detect anything.
| S2 | S1 | Price | R1 | R2 | R3 | |
|---|---|---|---|---|---|---|
| ProTrendLines | 0.144439 | 0.200000 | 0.220000 | 0.280000 | 0.490000 | 0.580000 |
| Change (%) | -34.35% | -9.09% | - | +27.27% | +122.73% | +163.64% |
| Change | -0.075561 | -0.020000 | - | +0.060000 | +0.270000 | +0.360000 |
| Level | Intermediate | Intermediate | - | Intermediate | Minor | Minor |
Pivot points can also be used to set your price objectives. Here is the price situation in relation to pivot points:
| Pivot points | S3 | S2 | S1 | PP | R1 | R2 | R3 |
|---|---|---|---|---|---|---|---|
| Standard | 0.163333 | 0.176667 | 0.183333 | 0.196667 | 0.203333 | 0.216667 | 0.223333 |
| Camarilla | 0.184500 | 0.186333 | 0.188167 | 0.190000 | 0.191833 | 0.193667 | 0.195500 |
| Woodie | 0.160000 | 0.175000 | 0.180000 | 0.195000 | 0.200000 | 0.215000 | 0.220000 |
| Fibonacci | 0.176667 | 0.184307 | 0.189027 | 0.196667 | 0.204307 | 0.209027 | 0.216667 |
| Pivot points | S3 | S2 | S1 | PP | R1 | R2 | R3 |
|---|---|---|---|---|---|---|---|
| Standard | 0.063333 | 0.126667 | 0.163333 | 0.226667 | 0.263333 | 0.326667 | 0.363333 |
| Camarilla | 0.172500 | 0.181667 | 0.190833 | 0.200000 | 0.209167 | 0.218333 | 0.227500 |
| Woodie | 0.050000 | 0.120000 | 0.150000 | 0.220000 | 0.250000 | 0.320000 | 0.350000 |
| Fibonacci | 0.126667 | 0.164867 | 0.188467 | 0.226667 | 0.264867 | 0.288467 | 0.326667 |
| Pivot points | S3 | S2 | S1 | PP | R1 | R2 | R3 |
|---|---|---|---|---|---|---|---|
| Standard | -0.193333 | -0.036667 | 0.076667 | 0.233333 | 0.346667 | 0.503333 | 0.616667 |
| Camarilla | 0.115750 | 0.140500 | 0.165250 | 0.190000 | 0.214750 | 0.239500 | 0.264250 |
| Woodie | -0.215000 | -0.047500 | 0.055000 | 0.222500 | 0.325000 | 0.492500 | 0.595000 |
| Fibonacci | -0.036667 | 0.066473 | 0.130193 | 0.233333 | 0.336473 | 0.400193 | 0.503333 |
Numerical data
The following is the status of technical indicators and moving averages registered at the time this technical analysis was created:
| RSI (14): | 54.39 | |
| MACD (12,26,9): | 0.0016 | |
| Directional Movement: | 10.706983 | |
| AROON (14): | 21.428572 | |
| DEMA (21): | 0.216776 | |
| Parabolic SAR (0,02-0,02-0,2): | 0.313784 | |
| Elder Ray (13): | -0.003717 | |
| Super Trend (3,10): | 0.131690 | |
| Zig ZAG (10): | 0.250000 | |
| VORTEX (21): | 0.9753 | |
| Stochastique (14,3,5): | 30.95 | |
| TEMA (21): | 0.226520 | |
| Williams %R (14): | -42.86 | |
| Chande Momentum Oscillator (20): | 0.070000 | |
| Repulse (5,40,3): | 16.5586 | |
| ROCnROLL: | 1 | |
| TRIX (15,9): | -0.0902 | |
| Courbe Coppock: | 42.41 |
| MA7: | 0.224286 | |
| MA20: | 0.209500 | |
| MA50: | 0.230800 | |
| MA100: | 0.228800 | |
| MAexp7: | 0.222712 | |
| MAexp20: | 0.216665 | |
| MAexp50: | 0.225210 | |
| MAexp100: | 0.259958 | |
| Price / MA7: | -1.91% | |
| Price / MA20: | +5.01% | |
| Price / MA50: | -4.68% | |
| Price / MA100: | -3.85% | |
| Price / MAexp7: | -1.22% | |
| Price / MAexp20: | +1.54% | |
| Price / MAexp50: | -2.31% | |
| Price / MAexp100: | -15.37% |
About author

Online


Add a comment
Comments
0 comments on the analysis WAZIRX - WRX/USD - Daily