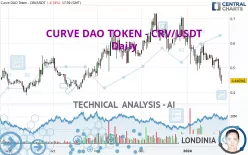
CURVE DAO TOKEN - CRV/USDT - Daily - Technical analysis published on 01/24/2024 (GMT)
- 316
- 0
Click here for a new analysis!
- Timeframe : Daily
- - Analysis generated on
- Status : LEVEL MAINTAINED

Summary of the analysis

Additional analysis
Quotes
The CURVE DAO TOKEN - CRV/USDT rating is 0.446941 USDT. The price is lower by -4.74% since the last closing and was traded between 0.435251 USDT and 0.471560 USDT over the period. The price is currently at +2.69% from its lowest and -5.22% from its highest.The Central Gaps scanner detects a bullish opening marking the presence of buyers ahead of sellers at the opening but not sufficiently marked to allow the price to register a quotation gap.
Bullish opening
Type : Bullish
Timeframe : Openning
Here is a more detailed summary of the historical variations registered by CURVE DAO TOKEN - CRV/USDT:
New LOW record (1st january)
Type : Bearish
Timeframe : Weekly
New LOW record (1 month)
Type : Bearish
Timeframe : Weekly
The Central Volumes scanner detects abnormal volumes on the asset:
Abnormal volumes
Timeframe : 5 days
Abnormal volumes
Timeframe : 20 days
Abnormal volumes
Timeframe : 50 days
Technical
A technical analysis in Daily of this CURVE DAO TOKEN - CRV/USDT chart shows a sharp bearish trend. 89.29% of the signals given by moving averages are bearish. This strongly bearish trend is supported by the strong bearish signals given by short-term moving averages. The Central Indicators scanner does not detect any result on moving averages that would impact this trend.
Technical indicators are strongly bearish, suggesting that the price decline is expected to continue.
But beware of excesses. The Central Indicators scanner currently detects this:
CCI indicator is oversold : under -100
Type : Neutral
Timeframe : Daily
Williams %R indicator is oversold : under -80
Type : Neutral
Timeframe : Daily
Pivot points : price is under support 1
Type : Neutral
Timeframe : Daily
Pivot points : price is under support 3
Type : Neutral
Timeframe : Weekly
The Central Patterns scanner, which studies chart patterns, resistances and supports, has identified this signal:
Near support of channel
Type : Bullish
Timeframe : Daily
No result was found by the Central Candlesticks scanner on Japanese candlesticks.
| S1 | Price | R1 | R2 | R3 | |
|---|---|---|---|---|---|
| ProTrendLines | 0.414207 | 0.446941 | 0.450208 | 0.505552 | 0.582621 |
| Change (%) | -7.32% | - | +0.73% | +13.11% | +30.36% |
| Change | -0.032734 | - | +0.003267 | +0.058611 | +0.135680 |
| Level | Intermediate | - | Minor | Major | Intermediate |
Attention could also be paid to pivot points to set price objectives:
| Pivot points | S3 | S2 | S1 | PP | R1 | R2 | R3 |
|---|---|---|---|---|---|---|---|
| Standard | 0.397496 | 0.427847 | 0.448503 | 0.478854 | 0.499510 | 0.529861 | 0.550517 |
| Camarilla | 0.455132 | 0.459808 | 0.464483 | 0.469159 | 0.473835 | 0.478510 | 0.483186 |
| Woodie | 0.392649 | 0.425423 | 0.443656 | 0.476430 | 0.494663 | 0.527437 | 0.545670 |
| Fibonacci | 0.427847 | 0.447332 | 0.459369 | 0.478854 | 0.498339 | 0.510376 | 0.529861 |
| Pivot points | S3 | S2 | S1 | PP | R1 | R2 | R3 |
|---|---|---|---|---|---|---|---|
| Standard | 0.429939 | 0.462323 | 0.495029 | 0.527413 | 0.560119 | 0.592503 | 0.625209 |
| Camarilla | 0.509835 | 0.515802 | 0.521768 | 0.527735 | 0.533702 | 0.539668 | 0.545635 |
| Woodie | 0.430100 | 0.462404 | 0.495190 | 0.527494 | 0.560280 | 0.592584 | 0.625370 |
| Fibonacci | 0.462323 | 0.487187 | 0.502549 | 0.527413 | 0.552277 | 0.567639 | 0.592503 |
| Pivot points | S3 | S2 | S1 | PP | R1 | R2 | R3 |
|---|---|---|---|---|---|---|---|
| Standard | 0.381384 | 0.473345 | 0.539333 | 0.631294 | 0.697282 | 0.789243 | 0.855231 |
| Camarilla | 0.561886 | 0.576365 | 0.590843 | 0.605322 | 0.619801 | 0.634279 | 0.648758 |
| Woodie | 0.368399 | 0.466852 | 0.526348 | 0.624801 | 0.684297 | 0.782750 | 0.842246 |
| Fibonacci | 0.473345 | 0.533681 | 0.570957 | 0.631294 | 0.691630 | 0.728906 | 0.789243 |
Numerical data
The following is the status of the technical indicators and moving averages at the time of publication of this technical analysis:
| RSI (14): | 32.32 | |
| MACD (12,26,9): | -0.0300 | |
| Directional Movement: | -23.168220 | |
| AROON (14): | -85.714286 | |
| DEMA (21): | 0.495609 | |
| Parabolic SAR (0,02-0,02-0,2): | 0.537583 | |
| Elder Ray (13): | -0.062392 | |
| Super Trend (3,10): | 0.568293 | |
| Zig ZAG (10): | 0.445251 | |
| VORTEX (21): | 0.9014 | |
| Stochastique (14,3,5): | 7.05 | |
| TEMA (21): | 0.477717 | |
| Williams %R (14): | -94.66 | |
| Chande Momentum Oscillator (20): | -0.106949 | |
| Repulse (5,40,3): | -15.5244 | |
| ROCnROLL: | 2 | |
| TRIX (15,9): | -0.5914 | |
| Courbe Coppock: | 18.83 |
| MA7: | 0.502682 | |
| MA20: | 0.532574 | |
| MA50: | 0.593157 | |
| MA100: | 0.566509 | |
| MAexp7: | 0.495198 | |
| MAexp20: | 0.532415 | |
| MAexp50: | 0.562696 | |
| MAexp100: | 0.568304 | |
| Price / MA7: | -11.09% | |
| Price / MA20: | -16.08% | |
| Price / MA50: | -24.65% | |
| Price / MA100: | -21.11% | |
| Price / MAexp7: | -9.74% | |
| Price / MAexp20: | -16.05% | |
| Price / MAexp50: | -20.57% | |
| Price / MAexp100: | -21.36% |
About author

Online


Add a comment
Comments
0 comments on the analysis CURVE DAO TOKEN - CRV/USDT - Daily