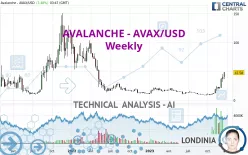
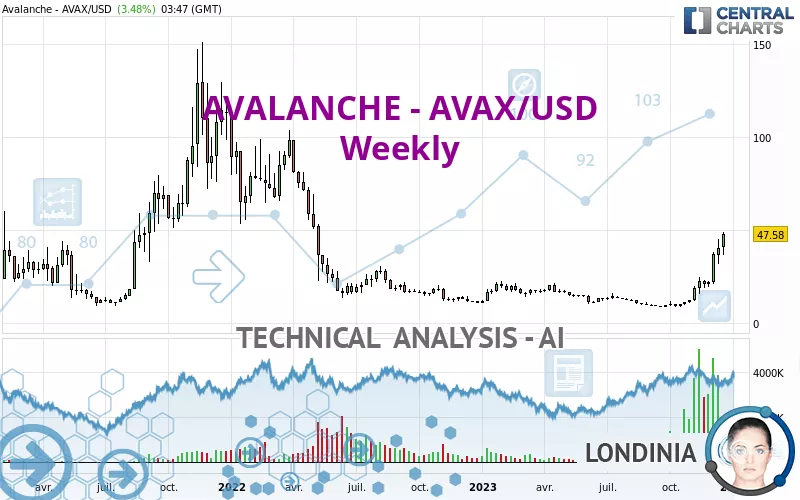
AVALANCHE - AVAX/USD - Weekly - Technical analysis published on 12/22/2023 (GMT)
- 161
- 0
Click here for a new analysis!
- Timeframe : Weekly
- - Analysis generated on
- Status : INVALID
Summary of the analysis

Additional analysis
Quotes
The AVALANCHE - AVAX/USD price is 47.58 USD. The price registered an increase of +12.78% over 5 days and has been traded over the last 5 days between 36.47 USD and 48.88 USD. This implies that the 5 day price is +30.46% from its lowest point and -2.66% from its highest point.Here is a more detailed summary of the historical variations registered by AVALANCHE - AVAX/USD:
New HIGH record (1 year)
Type : Bullish
Timeframe : Weekly
New HIGH record (1st january)
Type : Bullish
Timeframe : Weekly
New HIGH record (1 month)
Type : Bullish
Timeframe : Weekly
The Central Volumes scanner detects abnormal volumes on the asset:
Abnormal volumes
Timeframe : 5 days
Abnormal volumes
Timeframe : 20 days
Abnormal volumes
Timeframe : 50 days
Technical
Technical analysis of AVALANCHE - AVAX/USD in Weekly shows an overall bullish trend. 67.86% of the signals given by moving averages are bullish. The overall trend is reinforced by the strong bullish signals from short-term moving averages. The Central Indicators scanner detects a bullish signal on moving averages that could impact this trend:
Moving Average bullish crossovers : MA20 & MA50
Type : Bullish
Timeframe : Weekly
Technical indicators are strongly bullish, suggesting that the price increase should continue.
Caution: the Central Indicators scanner currently detects an excess:
RSI indicator is overbought : over 80
Type : Neutral
Timeframe : Weekly
CCI indicator is overbought : over 100
Type : Neutral
Timeframe : Weekly
Previous candle closed over Bollinger bands
Type : Neutral
Timeframe : Weekly
Williams %R indicator is overbought : over -20
Type : Neutral
Timeframe : Weekly
Central Patterns, the scanner specializing in chart patterns, did not identify any signals.
The presence of a bullish Japanese candlestick pattern detected by Central Candlesticks that could cause a very short term rebound was also detected:
Long white line
Type : Bullish
Timeframe : Weekly
| S3 | S2 | S1 | Price | R1 | R2 | R3 | |
|---|---|---|---|---|---|---|---|
| ProTrendLines | 9.73 | 20.94 | 39.13 | 47.58 | 59.79 | 76.89 | 98.08 |
| Change (%) | -79.55% | -55.99% | -17.76% | - | +25.66% | +61.60% | +106.14% |
| Change | -37.85 | -26.64 | -8.45 | - | +12.21 | +29.31 | +50.50 |
| Level | Major | Major | Intermediate | - | Minor | Minor | Minor |
Attention could also be paid to pivot points to set price objectives:
| Pivot points | S3 | S2 | S1 | PP | R1 | R2 | R3 |
|---|---|---|---|---|---|---|---|
| Standard | 39.37 | 41.24 | 43.61 | 45.48 | 47.85 | 49.72 | 52.09 |
| Camarilla | 44.81 | 45.20 | 45.59 | 45.98 | 46.37 | 46.76 | 47.15 |
| Woodie | 39.62 | 41.37 | 43.86 | 45.61 | 48.10 | 49.85 | 52.34 |
| Fibonacci | 41.24 | 42.86 | 43.86 | 45.48 | 47.10 | 48.10 | 49.72 |
| Pivot points | S3 | S2 | S1 | PP | R1 | R2 | R3 |
|---|---|---|---|---|---|---|---|
| Standard | 20.36 | 25.97 | 34.08 | 39.69 | 47.80 | 53.41 | 61.52 |
| Camarilla | 38.42 | 39.68 | 40.93 | 42.19 | 43.45 | 44.71 | 45.96 |
| Woodie | 21.61 | 26.60 | 35.33 | 40.32 | 49.05 | 54.04 | 62.77 |
| Fibonacci | 25.97 | 31.21 | 34.45 | 39.69 | 44.93 | 48.17 | 53.41 |
| Pivot points | S3 | S2 | S1 | PP | R1 | R2 | R3 |
|---|---|---|---|---|---|---|---|
| Standard | 0.41 | 5.93 | 13.66 | 19.18 | 26.91 | 32.43 | 40.16 |
| Camarilla | 17.74 | 18.95 | 20.17 | 21.38 | 22.60 | 23.81 | 25.02 |
| Woodie | 1.51 | 6.48 | 14.76 | 19.73 | 28.01 | 32.98 | 41.26 |
| Fibonacci | 5.93 | 11.00 | 14.12 | 19.18 | 24.25 | 27.37 | 32.43 |
Numerical data
The following are the details of the technical indicators and moving averages that were collected to generate this technical analysis:
| RSI (14): | 87.29 | |
| MACD (12,26,9): | 6.2700 | |
| Directional Movement: | 45.97 | |
| AROON (14): | 85.71 | |
| DEMA (21): | 28.29 | |
| Parabolic SAR (0,02-0,02-0,2): | 17.04 | |
| Elder Ray (13): | 16.90 | |
| Super Trend (3,10): | 24.49 | |
| Zig ZAG (10): | 47.79 | |
| VORTEX (21): | 1.2800 | |
| Stochastique (14,3,5): | 95.16 | |
| TEMA (21): | 34.96 | |
| Williams %R (14): | -3.26 | |
| Chande Momentum Oscillator (20): | 37.83 | |
| Repulse (5,40,3): | 69.2200 | |
| ROCnROLL: | 1 | |
| TRIX (15,9): | 2.1500 | |
| Courbe Coppock: | 427.88 |
| MA7: | 42.93 | |
| MA20: | 35.77 | |
| MA50: | 25.38 | |
| MA100: | 17.56 | |
| MAexp7: | 32.62 | |
| MAexp20: | 21.98 | |
| MAexp50: | 19.42 | |
| MAexp100: | 22.60 | |
| Price / MA7: | +10.83% | |
| Price / MA20: | +33.02% | |
| Price / MA50: | +87.47% | |
| Price / MA100: | +170.96% | |
| Price / MAexp7: | +45.86% | |
| Price / MAexp20: | +116.47% | |
| Price / MAexp50: | +145.01% | |
| Price / MAexp100: | +110.53% |
About author

Online


Add a comment
Comments
0 comments on the analysis AVALANCHE - AVAX/USD - Weekly