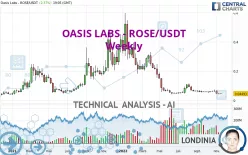
OASIS - ROSE/USDT - Weekly - Technical analysis published on 11/22/2022 (GMT)
- 300
- 0
Click here for a new analysis!
- Timeframe : Weekly
- - Analysis generated on
- Status : INVALID

Summary of the analysis

Additional analysis
Quotes
The OASIS LABS - ROSE/USDT rating is 0.044930 USDT. The price registered a decrease of -3.38% over 5 days and has been traded over the last 5 days between 0.042600 USDT and 0.048010 USDT. This implies that the 5 day price is +5.47% from its lowest point and -6.42% from its highest point.The Central Gaps scanner detects a bullish opening. A small advantage for buyers in the very short term.
Bullish opening
Type : Bullish
Timeframe : Openning
So that you have an overall view of the price change, here is a table showing the variations over several periods:
Near a new LOW record (1 year)
Type : Bearish
Timeframe : Weekly
Near a new LOW record (1 month)
Type : Bearish
Timeframe : Weekly
Technical
Technical analysis of this Weekly chart of OASIS LABS - ROSE/USDT indicates that the overall trend is bearish. 78.57% of the signals given by moving averages are bearish. This bearish trend is supported by the strong bearish signals given by short-term moving averages. There is no crossing of moving average by the price or crossing of moving averages between themselves.
The probability of a further decline is low given the direction of the technical indicators.
But beware of excesses. The Central Indicators scanner currently detects this:
CCI indicator is oversold : under -100
Type : Neutral
Timeframe : Weekly
Williams %R indicator is oversold : under -80
Type : Neutral
Timeframe : Weekly
Price is back under the pivot point
Type : Bearish
Timeframe : Weekly
The analysis of the price chart with Central Patterns scanners does not return any result.
The Central Candlesticks scanner, specialised in Japanese candlesticks, did not identify any signals.
| S1 | Price | R1 | R2 | R3 | |
|---|---|---|---|---|---|
| ProTrendLines | 0.039760 | 0.044930 | 0.112600 | 0.284600 | 0.415800 |
| Change (%) | -11.51% | - | +150.61% | +533.43% | +825.44% |
| Change | -0.005170 | - | +0.067670 | +0.239670 | +0.370870 |
| Level | Intermediate | - | Intermediate | Minor | Minor |
Attention could also be paid to pivot points to set price objectives:
| Pivot points | S3 | S2 | S1 | PP | R1 | R2 | R3 |
|---|---|---|---|---|---|---|---|
| Standard | 0.039907 | 0.040983 | 0.042437 | 0.043513 | 0.044967 | 0.046043 | 0.047497 |
| Camarilla | 0.043194 | 0.043426 | 0.043658 | 0.043890 | 0.044122 | 0.044354 | 0.044586 |
| Woodie | 0.040095 | 0.041078 | 0.042625 | 0.043608 | 0.045155 | 0.046138 | 0.047685 |
| Fibonacci | 0.040983 | 0.041950 | 0.042547 | 0.043513 | 0.044480 | 0.045077 | 0.046043 |
| Pivot points | S3 | S2 | S1 | PP | R1 | R2 | R3 |
|---|---|---|---|---|---|---|---|
| Standard | 0.037793 | 0.040457 | 0.043493 | 0.046157 | 0.049193 | 0.051857 | 0.054893 |
| Camarilla | 0.044963 | 0.045485 | 0.046008 | 0.046530 | 0.047053 | 0.047575 | 0.048098 |
| Woodie | 0.037980 | 0.040550 | 0.043680 | 0.046250 | 0.049380 | 0.051950 | 0.055080 |
| Fibonacci | 0.040457 | 0.042634 | 0.043979 | 0.046157 | 0.048334 | 0.049679 | 0.051857 |
| Pivot points | S3 | S2 | S1 | PP | R1 | R2 | R3 |
|---|---|---|---|---|---|---|---|
| Standard | 0.036027 | 0.043193 | 0.051897 | 0.059063 | 0.067767 | 0.074933 | 0.083637 |
| Camarilla | 0.056236 | 0.057691 | 0.059145 | 0.060600 | 0.062055 | 0.063510 | 0.064964 |
| Woodie | 0.036795 | 0.043578 | 0.052665 | 0.059448 | 0.068535 | 0.075318 | 0.084405 |
| Fibonacci | 0.043193 | 0.049256 | 0.053001 | 0.059063 | 0.065126 | 0.068871 | 0.074933 |
Numerical data
The following is the status of the technical indicators and moving averages at the time of publication of this technical analysis:
| RSI (14): | 37.31 | |
| MACD (12,26,9): | -0.0221 | |
| Directional Movement: | -5.511128 | |
| AROON (14): | -100.000000 | |
| DEMA (21): | 0.035351 | |
| Parabolic SAR (0,02-0,02-0,2): | 0.104106 | |
| Elder Ray (13): | -0.013886 | |
| Super Trend (3,10): | 0.092080 | |
| Zig ZAG (10): | 0.044480 | |
| VORTEX (21): | 0.9879 | |
| Stochastique (14,3,5): | 5.28 | |
| TEMA (21): | 0.041176 | |
| Williams %R (14): | -91.97 | |
| Chande Momentum Oscillator (20): | -0.020030 | |
| Repulse (5,40,3): | -25.3818 | |
| ROCnROLL: | 2 | |
| TRIX (15,9): | -3.6040 | |
| Courbe Coppock: | 42.89 |
| MA7: | 0.045583 | |
| MA20: | 0.052166 | |
| MA50: | 0.056143 | |
| MA100: | 0.060506 | |
| MAexp7: | 0.052441 | |
| MAexp20: | 0.068598 | |
| MAexp50: | 0.110075 | |
| MAexp100: | 0.141281 | |
| Price / MA7: | -1.43% | |
| Price / MA20: | -13.87% | |
| Price / MA50: | -19.97% | |
| Price / MA100: | -25.74% | |
| Price / MAexp7: | -14.32% | |
| Price / MAexp20: | -34.50% | |
| Price / MAexp50: | -59.18% | |
| Price / MAexp100: | -68.20% |
About author

Online


Add a comment
Comments
0 comments on the analysis OASIS - ROSE/USDT - Weekly