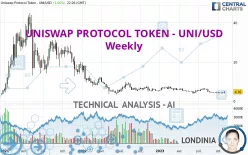
UNISWAP - UNI/USD - Weekly - Technical analysis published on 11/05/2023 (GMT)
- 150
- 0
Click here for a new analysis!
- Timeframe : Weekly
- - Analysis generated on
- Status : INVALID
Summary of the analysis

Additional analysis
Quotes
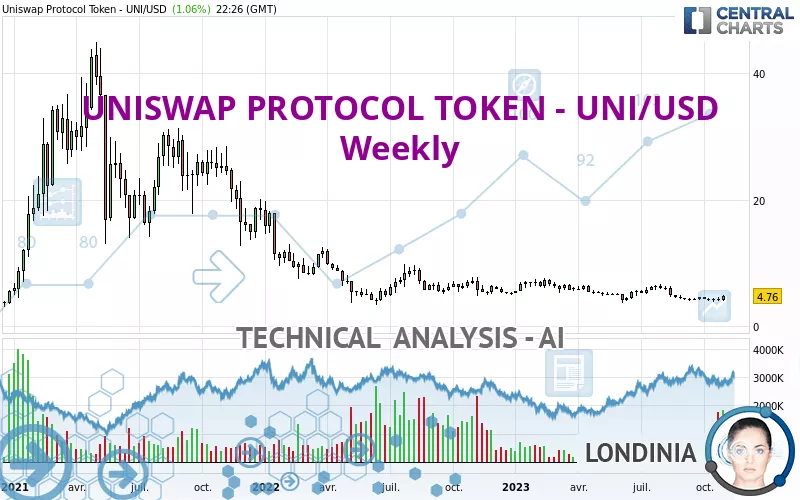
The UNISWAP PROTOCOL TOKEN - UNI/USD rating is 4.76 USD. The price is up +13.88% over 5 days and was traded between 4.02 USD and 4.92 USD over the period. The price is currently at +18.41% from its lowest point and -3.25% from its highest point.Here is a more detailed summary of the historical variations registered by UNISWAP PROTOCOL TOKEN - UNI/USD:
Near a new HIGH record (1 month)
Type : Bullish
Timeframe : Weekly
The Central Volumes scanner notes the presence of abnormal volumes:
Abnormal volumes
Timeframe : 5 days
Abnormal volumes
Timeframe : 20 days
Abnormal volumes
Timeframe : 50 days
Technical
Technical analysis of UNISWAP PROTOCOL TOKEN - UNI/USD in Weekly shows a overall strongly bearish trend. 92.86% of the signals given by moving averages are bearish. This strongly bearish trend is supported by the strong bearish signals given by short-term moving averages. An assessment of moving averages reveals a bullish signal that could impact this trend:
Bullish trend reversal : Moving Average 20
Type : Bullish
Timeframe : Weekly
In fact, of the 18 technical indicators analysed by Central Analyzer, 7 are bullish, 6 are neutral and 5 are bearish. Central Indicators, the detector scanner for these technical indicators has recently detected several signals:
Pivot points : price is over resistance 1
Type : Neutral
Timeframe : Weekly
MACD crosses UP its Moving Average
Type : Bullish
Timeframe : Weekly
The analysis of the price chart with Central Patterns scanners does not return any result.
The Central Candlesticks scanner, specialised in Japanese candlesticks, did not identify any signals.
| S1 | Price | R1 | R2 | R3 | |
|---|---|---|---|---|---|
| ProTrendLines | 3.88 | 4.76 | 7.52 | 14.56 | 31.36 |
| Change (%) | -18.49% | - | +57.98% | +205.88% | +558.82% |
| Change | -0.88 | - | +2.76 | +9.80 | +26.60 |
| Level | Major | - | Minor | Minor | Intermediate |
Attention could also be paid to pivot points to set price objectives:
| Pivot points | S3 | S2 | S1 | PP | R1 | R2 | R3 |
|---|---|---|---|---|---|---|---|
| Standard | 4.47 | 4.54 | 4.63 | 4.70 | 4.79 | 4.86 | 4.95 |
| Camarilla | 4.67 | 4.68 | 4.70 | 4.71 | 4.73 | 4.74 | 4.75 |
| Woodie | 4.47 | 4.55 | 4.63 | 4.71 | 4.79 | 4.87 | 4.95 |
| Fibonacci | 4.54 | 4.60 | 4.64 | 4.70 | 4.76 | 4.80 | 4.86 |
| Pivot points | S3 | S2 | S1 | PP | R1 | R2 | R3 |
|---|---|---|---|---|---|---|---|
| Standard | 3.26 | 3.64 | 4.17 | 4.55 | 5.08 | 5.46 | 5.99 |
| Camarilla | 4.46 | 4.54 | 4.63 | 4.71 | 4.79 | 4.88 | 4.96 |
| Woodie | 3.35 | 3.68 | 4.26 | 4.59 | 5.17 | 5.50 | 6.08 |
| Fibonacci | 3.64 | 3.98 | 4.20 | 4.55 | 4.89 | 5.11 | 5.46 |
| Pivot points | S3 | S2 | S1 | PP | R1 | R2 | R3 |
|---|---|---|---|---|---|---|---|
| Standard | 2.93 | 3.38 | 3.77 | 4.22 | 4.61 | 5.06 | 5.45 |
| Camarilla | 3.92 | 4.00 | 4.07 | 4.15 | 4.23 | 4.30 | 4.38 |
| Woodie | 2.89 | 3.37 | 3.73 | 4.21 | 4.57 | 5.05 | 5.41 |
| Fibonacci | 3.38 | 3.70 | 3.90 | 4.22 | 4.54 | 4.74 | 5.06 |
Numerical data
The following are the details of the technical indicators and moving averages that were collected to generate this technical analysis:
| RSI (14): | 47.38 | |
| MACD (12,26,9): | -0.3300 | |
| Directional Movement: | -3.02 | |
| AROON (14): | -78.57 | |
| DEMA (21): | 4.33 | |
| Parabolic SAR (0,02-0,02-0,2): | 5.01 | |
| Elder Ray (13): | 0.16 | |
| Super Trend (3,10): | 5.93 | |
| Zig ZAG (10): | 4.75 | |
| VORTEX (21): | 1.0500 | |
| Stochastique (14,3,5): | 25.89 | |
| TEMA (21): | 4.32 | |
| Williams %R (14): | -63.89 | |
| Chande Momentum Oscillator (20): | -0.15 | |
| Repulse (5,40,3): | 7.6100 | |
| ROCnROLL: | -1 | |
| TRIX (15,9): | -0.9200 | |
| Courbe Coppock: | 40.81 |
| MA7: | 4.56 | |
| MA20: | 4.26 | |
| MA50: | 4.27 | |
| MA100: | 4.70 | |
| MAexp7: | 4.51 | |
| MAexp20: | 4.77 | |
| MAexp50: | 5.64 | |
| MAexp100: | 8.25 | |
| Price / MA7: | +4.39% | |
| Price / MA20: | +11.74% | |
| Price / MA50: | +11.48% | |
| Price / MA100: | +1.28% | |
| Price / MAexp7: | +5.54% | |
| Price / MAexp20: | -0.21% | |
| Price / MAexp50: | -15.60% | |
| Price / MAexp100: | -42.30% |
About author

Online


Add a comment
Comments
0 comments on the analysis UNISWAP - UNI/USD - Weekly